Figures & data
Scheme 1 Schematic illustration of the PSMA and esterase dual responsive CPT nanoparticles (CPT-WT-H NPs) with negatively charged surface, prolonged blood circulation, excellent PSMA-targeted delivery, enhanced tumor accumulation, potent antitumor efficacy and low side effects.
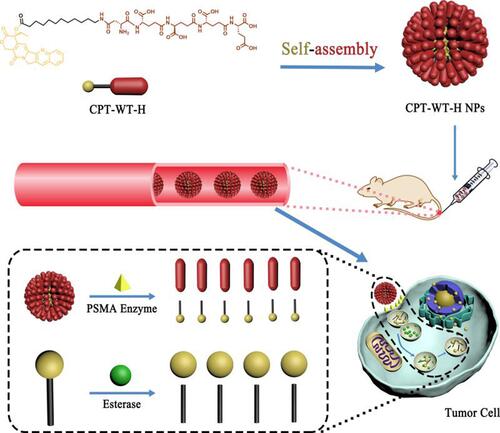
Figure 1 Characterization of CPT-WT-H NPs. (A) A TEM image of CPT-WT-H NPs dispersed in PBS (pH 7.4); inserts are the photographs of CPT-WT-H NPs in PBS in bright field (left) and under UV light at 365 nm with a red laser passing through (right). (B) DLS histograms of CPT-WT-H NPs in PBS. (C) Change of hydrodynamic diameter (Dh) of CPT-WT-H NPs in PBS for 120 h. (D) Schematic of sequential PSMA hydrolysis of CPT-WT-H (CPT12A-βAsp-GluγGluγGluγGlu) to yield the PSMA hydrolysate CPT12A-βAsp. (E) Characterization of in vitro PSMA response of CPT-WT-H NPs by LC-MS.
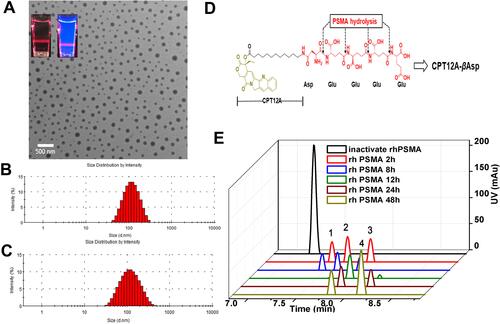
Figure 2 In vitro cytotoxicity of CPT-WT-H NPs and CPT against PSMA-expressing (PSMA+) cancer cell LNCaP-FGC (A) and non-PSMA-expressing (PSMA−) cancer cells HepG2 (B), MCF-7 (C), HeLa (D), DU145 (E), PC-3 (F) and normal liver cells LO2 (G), the IC50 values of CPT and CPT-WT-H NPs on different cell lines (H). ***p < 0.001, vs LNCaP-FGC cells.
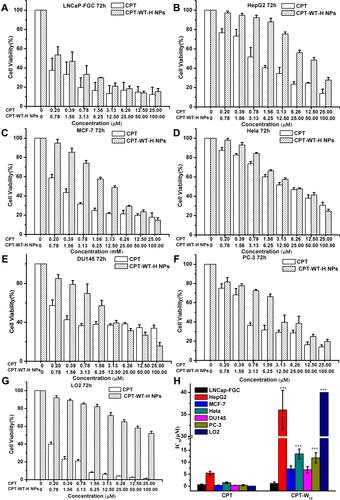
Figure 3 Cellular uptake of CPT-WT-H NPs in vitro. (A) CLSM images of LNCaP-FGC (PSMA+) cells incubated with CPT-WT-H NPs (10 μM) for 1 and 4 h. (B) CLSM images of HepG2 (PSMA−) cells incubated with CPT-WT-H NPs (10 μM) for 1 and 4 h. Nuclei were stained by PI (red), the blue color was indicative of CPT. (C) Mean fluorescence intensity of CPT-WT-H NPs internalized by LNCaP-FGC and HepG2 cells after incubation for 1, and 4 h. ***p < 0.001. (D) Flow cytometry analysis for apoptosis of LNCaP-FGC (PSMA+) (1) and HepG2 (PSMA−) (2) cells induced by CPT-WT-H NPs for 72 h. Q1, necrotic cells; Q2, late apoptotic cells; Q3, living cells; Q4, early apoptotic cells. Inserted numbers in the profiles indicate the percentage of the cells present in this area.
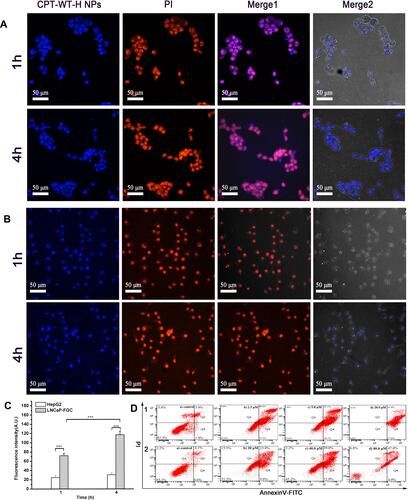
Figure 4 In vivo NIRF imaging of DiR-doped CPT-WT-H NPs. (A) In vivo NIRF images of the MCF-7 tumor-bearing nude mice (PSMA-producing) after intravenous injection of free DiR (0.25 mg·mL−1, 100 µL) or DiR-doped CPT-WT-H NPs (0.25 mg·mL−1, 100 µL). (B) Integrated fluorescence intensity of tumor obtained after intravenous injection of DiR-doped CPT-WT-H NPs (0.25 mg·mL−1, 100 µL). (C) Ex vivo NIRF images and (D) Integrated fluorescence intensity of the major organs and tumors excised at 48 h post intravenous injection of DiR-doped CPT-WT-H NPs, ***p < 0.001, vs tumor. (E) In vivo pharmacokinetics profiles of CPT-WT-H NPs s at the equivalent dose (30 mg·kg−1) in BALB/c mice. Error bars indicate SD (n = 6).
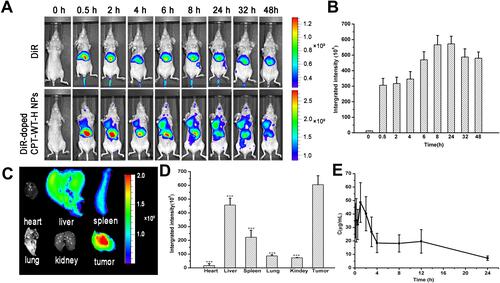
Figure 5 CPT-WT-H NPs significantly inhibited tumor progression and dramatically reduced side effects in an MCF-7 human breast cancer model. (A) The growth curves of MCF-7 tumor after treatment, which was initiated on day 13 post tumor inoculation, and drugs were intravenously injected every 2 days for 8 times (n = 6/group). (B) Changes of body weight in each group. (C) The tumor pictures in each group. (D) Excised tumor weight in each group. (E) Excised tumor volume in each group. *p < 0.05; ***p < 0.001. (F) Histological analysis of tumor sections stained with H&E.
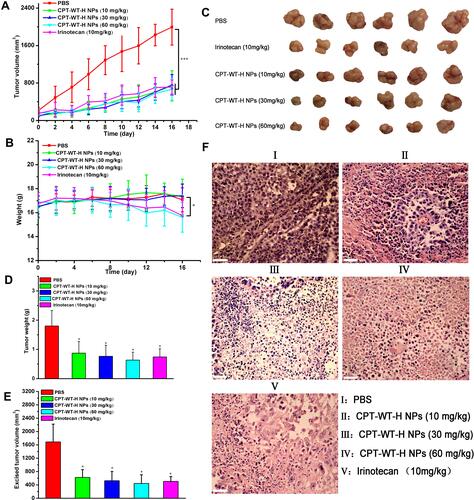
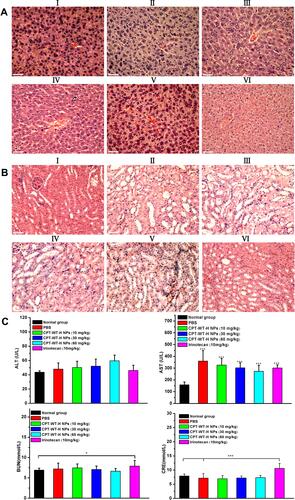
Figure 6 Representative H&E-stained histological images obtained from liver (A) and kidneys (B) after intravenous administration of irinotecan (10 mg·kg−1) and CPT-WT-H NPs (10, 30, 60 mg·kg−1). The PBS-treated group and the untreated group were used as the control. (I: PBS, II: CPT-WT-H NPs (10mg·kg−1), III: CPT-WT-H NPs (30mg·kg−1), IV: CPT-WT-H NPs (60mg·kg−1), V: Irinotecan (10 mg·kg−1), VI: Normal group). (C) Blood biochemical analysis of after the antitumor efficacy evaluation. The PBS-treated group and the untreated group were used as the control. The main parameters of hepatic and renal function are alanine transaminase (ALT), aspartate transaminase (AST), blood urea nitrogen (BUN), and creatinine (CRE). Error bars indicate SD (n = 6). *p < 0.05; ***p < 0.001.