Figures & data
Table 1 Physicochemical characterization of different SPIOs
Figure 1 SPIO core diameters were determined by transmission electron microscopy. (A) Representative TEM images of CDX–SPIO20, CDX–SPIO50, CDX–SPIO85, PEG–SPIO50, starch–SPIO50, PAA–SPIO50. White bars represent 100-nm scale, gray bars 30-nm scale. Crystallite core diameter distributions for the different sized CDX–SPIOs are shown in the upper plot and distributions for the differently coated SPIOs in the lower plot. Distribution was determined by measuring n ≥ 50 cores per SPIO type. Mean core diameter and standard deviation of all SPIO types are also presented in Lohrke et al.Citation11 FTIR spectra of all 50 nm SPIOs are shown in (B).
Abbreviations: CDX, carboxydextran; FTIR, fourier transform infrared spectroscopy; PAA, polyacrylic acid; PEG, polyethylene glycol; SPIO, superparamagnetic iron oxide nanoparticle.
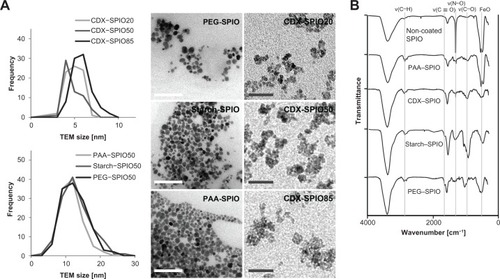
Figure 2 Size and coating dependency of proton relaxivity and magnetic characteristics. Longitudinal (A) and transversal (B) relaxivity are shown to be dependent on particle size. Relaxivities were determined at 40°C and 1.41 T. M/H hysteresis curves (C) represent the change of magnetization (emu g−1 iron) at increasing field strengths for the different CDX fractions at 300 K in aqueous solution as measured by SQUID.
Abbreviations: CDX, carboxydextran; emu, electromagnetic unit; H, magnetic field strength; M, magnetization; PAA, polyacrylic acid; PEG, polyethylene glycol; SPIO, superparamagnetic iron oxide nanoparticle; SQUID, superconducting quantum interference device; r, relaxivity.
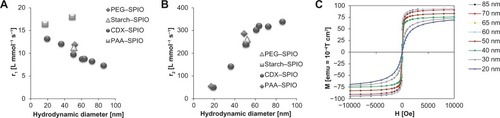
Figure 3 Dose dependency of blood kinetics. CDX–SPIO20 was injected into rats (n ≥ 3 per group) at doses of 12.5, 25, 50, and 100 μmol kg−1. Plasma samples were taken at indicated time points to determine the plasma iron concentration (A). Mean half-lives are summarized in (B).
Note: Error bars represent standard deviations of the mean.
Abbreviations: CDX, carboxydextran; SPIO, superparamagnetic iron oxide nanoparticle.
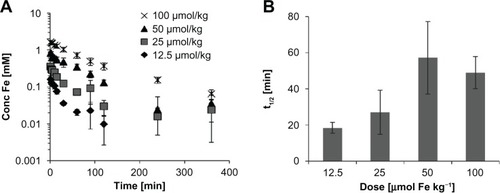
Table 2 Comparison of selected SPIO blood half-lives in rats determined by different methods
Figure 4 Comparison of different methods to determine the CDX–SPIO20 blood half-life. (A) T2*-weighted transversal MR images were acquired pre and post injection of CDX–SPIO20 application iv in rats and are shown here at representative time points. (B) Signal intensities pre (SI0) and post injection (SI) of the aorta (white circles in A) were analyzed to obtain blood clearance. The first values (white spheres) with constant low signal intensities were not used for the fit. (C) R2 relaxation rates of plasma samples taken from 3 minutes to 360 minutes were determined at 40°C and 1.41 T in a time-domain NMR. (D) The iron concentrations in the same plasma samples were measured by ICP–OES.
Note: The values were plotted versus time and fitted by single-order kinetics.
Abbreviations: CDX, carboxydextran; ICP-OES, inductively coupled plasma optical emission spectroscopy; iv, intravenous; MR, magnetic resonance; R, relaxation rate; SI, signal intensity; SPIO, superparamagnetic iron oxide nanoparticle.
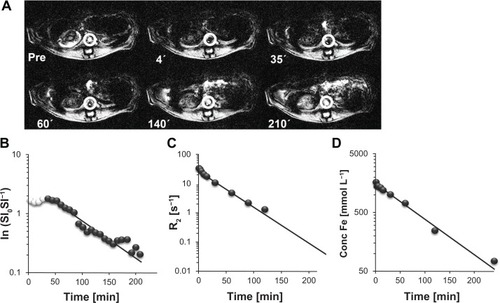
Table 3 Plasma kinetics in rats for all SPIO types
Figure 5 The blood half-life is dependent on the particle size and coating material.
Notes: SPIOs were injected at a dose of 100 μmol kg−1, and blood samples were taken pre and post injection up to 360 minutes. The iron concentration was determined in plasma by ICP–OES and used to calculate the half-life. Values represent mean of n ≥ 3 rats.
Abbreviations: CDX, carboxydextran; ICP-OES, inductively coupled plasma optical emission spectroscopy; PAA, polyacrylic acid; PEG, polyethylene glycol; SPIO, superparamagnetic iron oxide nanoparticle.
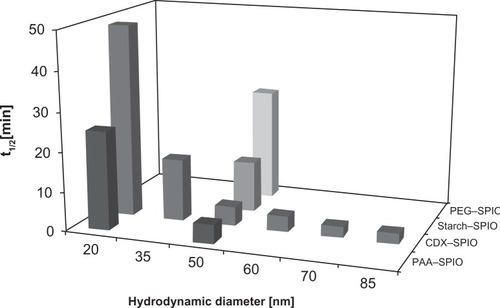
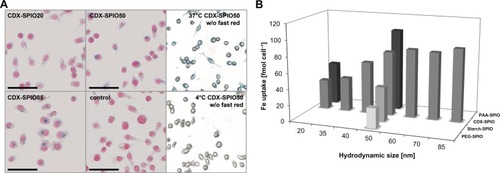
Figure 6 Size- and coating-dependent uptake by macrophages. P388D1 cells were incubated with 300 μmol L−1 SPIO solution for 4 hours at 37°C. (A) Prussian blue stain of phagocytized SPIOs. Representative images of cells incubated with CDX–SPIO20, CDX–SPIO50, and CDX–SPIO85 are shown exemplarily. Cells incubated without SPIOs served as control as well as cells incubated with CDX–SPIO50 at 4°C. (B) SPIO uptake was obtained by iron determination in the washed cells.
Note: Values represent means of at least four experiments.
Abbreviations: CDX, carboxydextran; PAA, polyacrylic acid; PEG, polyethylene glycol; SPIO, superparamagnetic iron oxide nanoparticle.