Figures & data
Figure 1 TEM image and particle size analysis of drug/human serum albumin (HSA) nanoparticles (NPs).
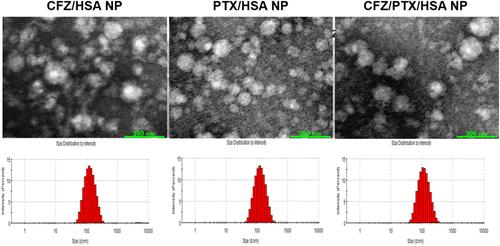
Table 1 50% Inhibitory Concentration (IC50) Values of Different Combinations of Carfilzomib and Paclitaxel
Figure 2 Characterization of the synergistic activity of combined carfilzomib (CFZ) and paclitaxel (PTX) treatment at different weight ratios.
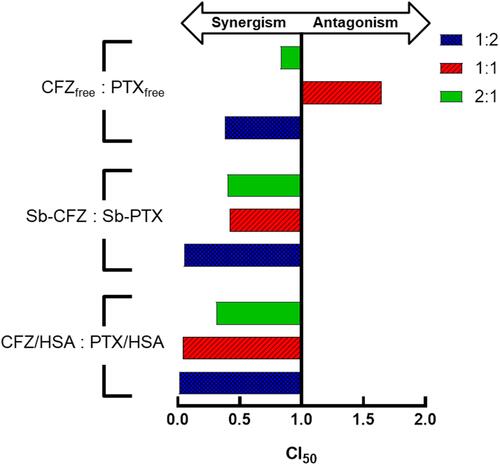
Figure 3 Drug release profiles of carfilzomib (CFZ, A) and paclitaxel (PTX, B). *p<0.05 and **p<0.005.
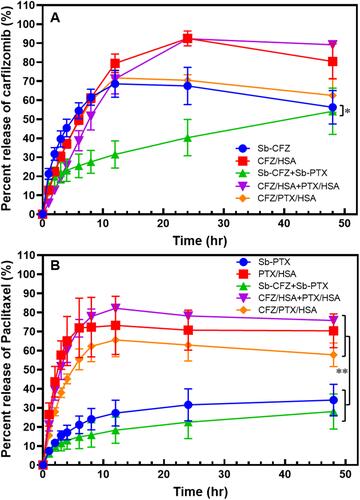
Table 2 Maximum Tolerance Dose Study for Various Combination Ratios of Carfilzomib and Paclitaxel on BALB/c Mice (n = 4)
Table 3 Pharmacokinetic Parameters of Carfilzomib Obtained from a Single Intravenous Bolus Administration of Various Formulations (Equivalent to 5 mg/kg Carfilzomib)
Table 4 Pharmacokinetic Parameters of Paclitaxel Obtained from a Single Intravenous Bolus Administration of Various Formulations (Equivalent to 10 mg/kg Paclitaxel)
Figure 4 Plasma concentration–time curves of carfilzomib (CFZ, A) and paclitaxel (PTX, B) after intravenous administration at respective doses of 5 and 10 mg/kg to rats.
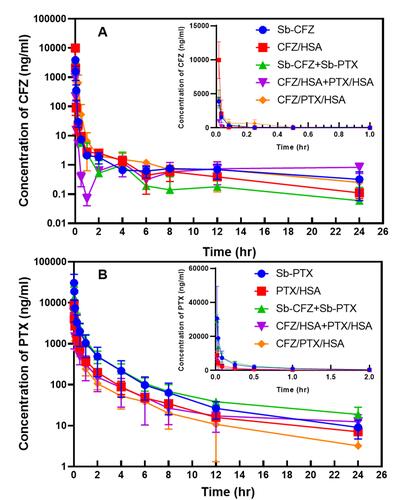
Figure 5 (A) MIA PaCa-2 tumor growth curve. (B) Tumor inhibition rates. (C) Tumor weights. (D) Body weight changes in tumor-bearing mice. 
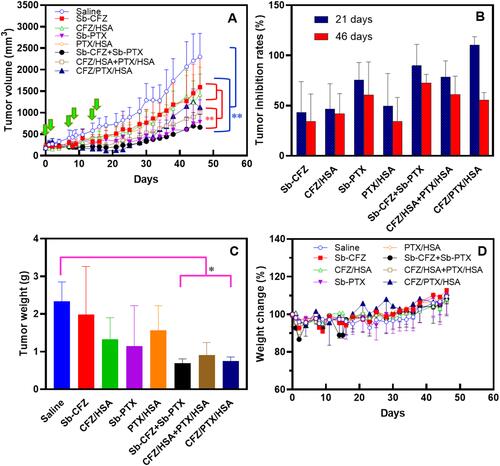
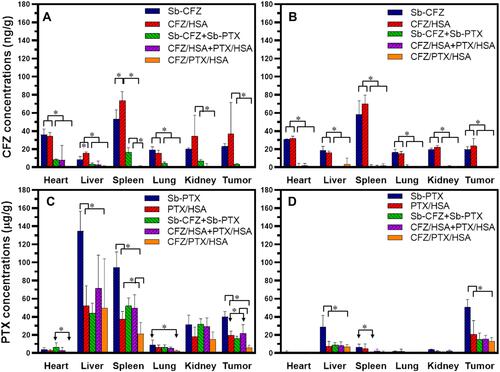
Figure 6 Tissue distributions of carfilzomib (CFZ) and paclitaxel (PTX) at 2 (A and C) and 8 h (B and D), respectively, after intravenous administration of solvent-based (Sb)-CFZ, Sb-PTX, CFZ/human serum albumin (HSA) nanoparticles (NPs), PTX/HSA NPs, Sb-CFZ+Sb-PTX (1:2), CFZ/HSA NPs+PTX/HSA NPs (1:2), or CFZ/PTX/HSA NPs (equivalent to 5 mg/kg CFZ and 10 mg/kg PTX in each mouse). *p<0.05.