Figures & data
Figure 1 Solubility of raloxifene hydrochloride in various oil and surfactant mixtures.
Note: Data expressed as mean ± standard error of mean (n = 3).
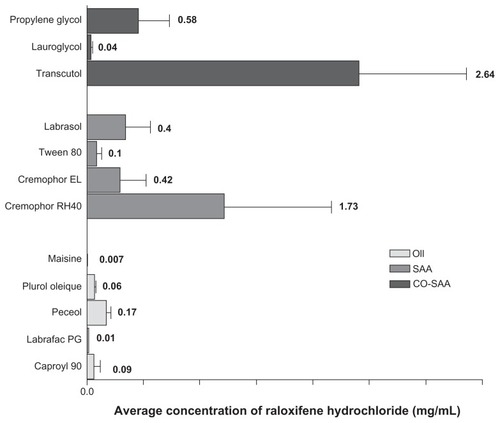
Table 1 Emulsification efficiency of various surfactants using different oily phases (1:1)
Table 2 Composition of self-nanoemulsifying nanocarriers constructing phase diagram A (Caproyl 90, Cremophor RH40, and Transcutol)
Table 3 Composition of self-nanoemulsifying nanocarriers constructing phase diagram B (Caproyl 90, Cremophor EL and Transcutol)
Figure 2 Ternary phase diagram of system A (Caproyl 90/Cremophor RH40/Transcutol).
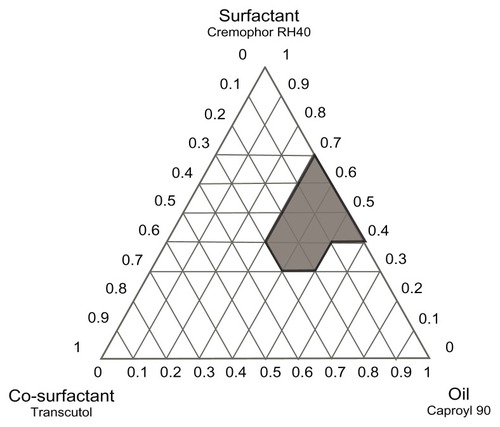
Figure 3 Ternary phase diagram of system B (Caproyl 90/Cremophor EL/Transcutol).
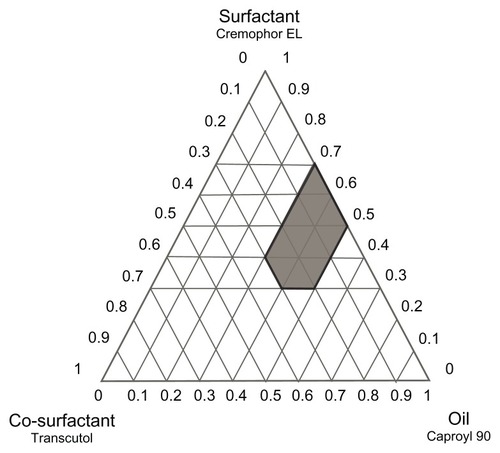
Figure 4 Solubility study of raloxifene in selected system ingredients with different triethanolamine ratios.
Note: Data expressed as mean value ± standard error of mean (n = 3).
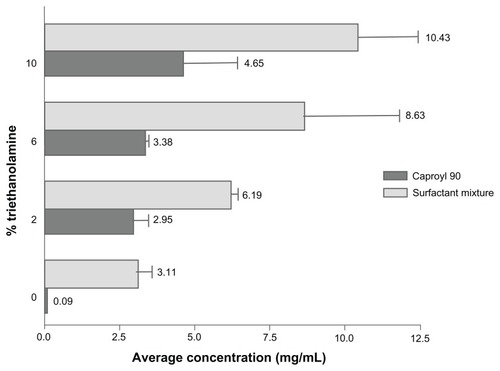
Table 4 Percentage transmittance of 2% RLX-loaded A-SNEDDS and NA-SNEDDS in different media with different folds of dilution at 638.2 nm
Table 5 Particle size, zeta potential (ZP), polydispersity index (PDI), and pH of selected self-nanoemulsifying formulations
Figure 5 Transmission electron microscopy photograph of nonalkalinized self-nanoemulsifying system with 1000-fold dilution in distilled water (×13,000).
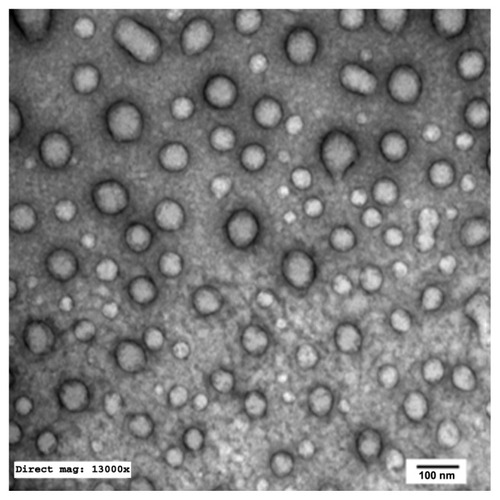
Figure 6 Transmission electron microscopy photograph of alkalinized self-nanoemulsifying system with 1000-folds dilution in distilled water (× 13,000).
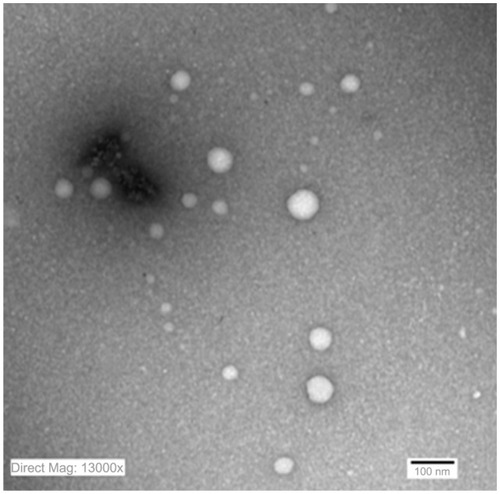
Figure 7 Transmission electron microscopy photograph of drug-loaded alkalinized self-nanoemulsifying system with 1000-fold dilution in distilled water (×40,000).
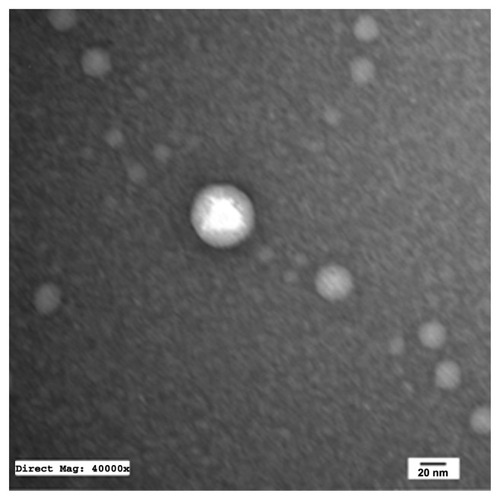
Figure 8 Transmission electron microscopy photograph of placebo nanocarriers with 1000-fold dilution in distilled water (×40,000).
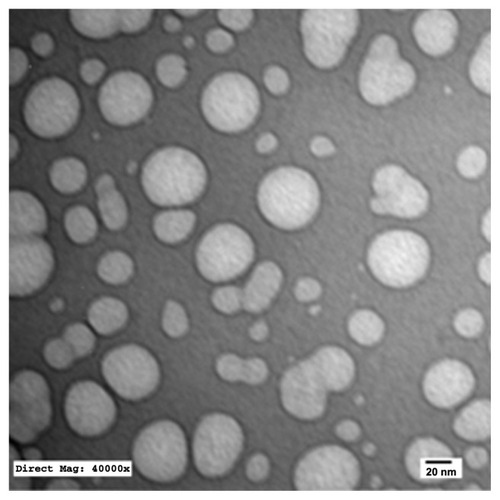
Figure 9 In vitro release of raloxifene aqueous suspension compared to alkalinized and nonalkalinized nanocarriers in 0.1% Tween 80 using dialysis bag method.
Note: Data expressed as mean ± standard error of mean.
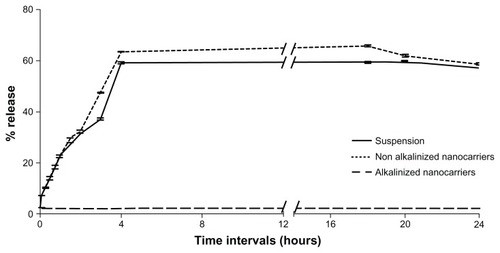
Figure 10 In-vitro release of raloxifene aqueous suspension compared to alkalinized (A-SNEDDS) and non-alkalinized (NA-SNEDDS) nanocarriers in 0.1% Tween 80 using dissolution cup method.
Note: Data expressed as mean ± standard error of mean.
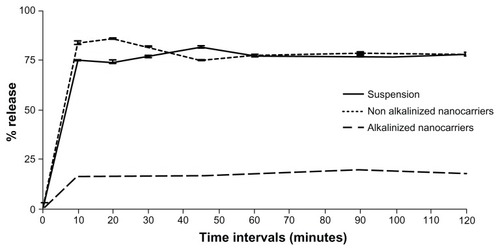
Figure 11 Photomicrographs of vaginal smears from female rats at (A) proestrus (nucleated epithelial cells), (B) estrus (cornified cells), (C) metaestrus (leukocytes, cornified, and nucleated epithelial cells), and (D) diestrus phase (leukocytes).
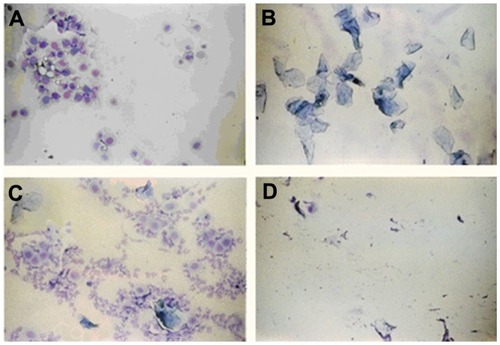
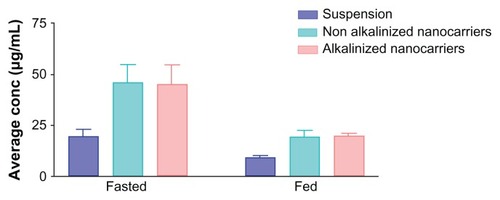
Figure 12 Assessment of raloxifene concentration (μg/mL) in endocrine system (uterus, fallopian tubes, and ovaries) in fed and fasted states from different formulations (suspension, alkalinized, and nonalkalinized self-nanoemulsifying drug-delivery systems) using high-performance liquid chromatography analysis.
Note: Data expressed as mean ± standard error of mean.