Figures & data
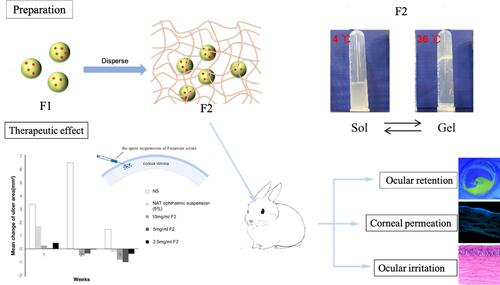
Figure 1 (A) Schematic illustrating the preparation of F2. (B) Infrared spectrogram of PLGA and PLGA-PEI, F3. (C) UV spectrogram of NAT and F1. (D) pH of NAT, PLGA@NAT, and F1. (E) Surface potential of NAT, PLGA@NAT, and F1. (F) Transmission electron micrograph images of F1. (G) Scanning electron microscope images of F1. (H) Particle size of PLGA, PLAG@NAT, and F1. (I) Particle size of F1 in PBS solution. (J) Drug release profiles of NAT in PLGA@NAT and F1. (K) The particle size of F2 with different gel concentrations at 4°C. (L) Change in the shear viscosity (η) of gel and F2 with different temperatures. (M) Temperature dependence of storage modulus (G′) and loss modulus (G″) of the gel. (N) Temperature dependence of the storage modulus (G′) and loss modulus (G″) of F2. (O) The gelation time of gel, Gel@PLGA-PEI-PEG, and F2.
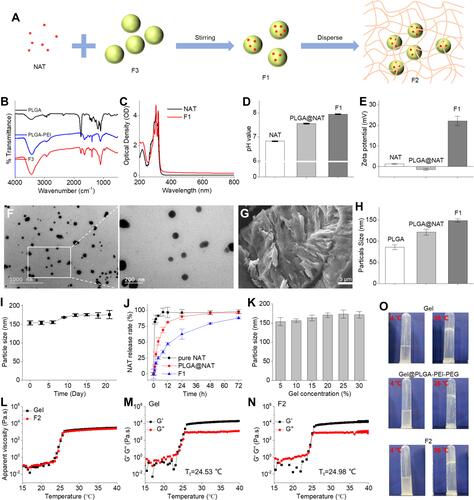
Table 1 Antifungal Activity of NAT, NAT Ophthalmic Suspension and F1 Against Fusarium Solanum
Figure 2 Cytotoxicity of the NAT ophthalmic suspension and F1 on HCE-T cells after incubating for 24 h. *P <0.05; **P <0.01 denote a statistically significant difference between the samples calculated with a two-sample t-test.
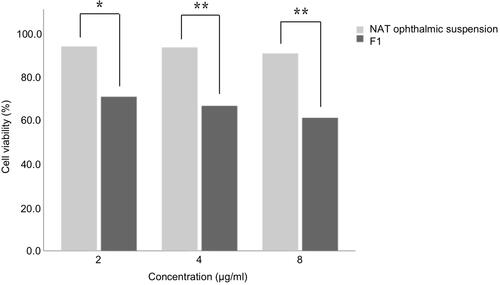
Figure 3 (A) Living and dead cell staining of HEC-T cells co-cultured with different concentrations of NAT ophthalmic suspension and F1 for 24 h (black scale bar=100 μm). (B) Cell death rate of HCE-T cells treated with NAT ophthalmic suspension and F1 for 24 h.
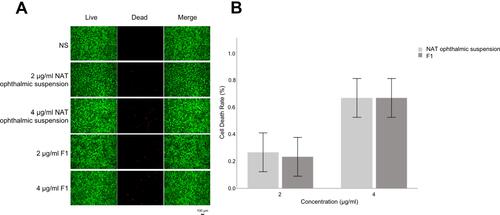
Figure 4 (A) Uptake of FITC-PLGA-PEI-PEG and FITC by HEC-T cells at different times. (B) The mean fluorescence intensity of FITC-PLGA-PEI-PEG and FITC in HCE-T cells and its variation with time. *P <0.05; **P <0.01 denote a statistically significant difference between the samples calculated by a two-sample t-test.
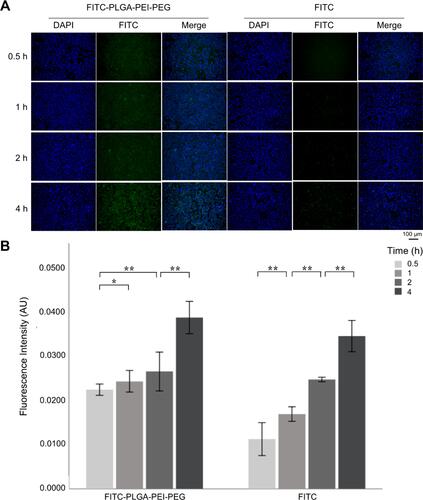
Figure 5 NAT content from different NAT formulations in the aqueous humor measured 24 h after the last administration. *P <0.05; **P <0.01 denote a statistically significant difference between the samples calculated with a two-sample t-test.
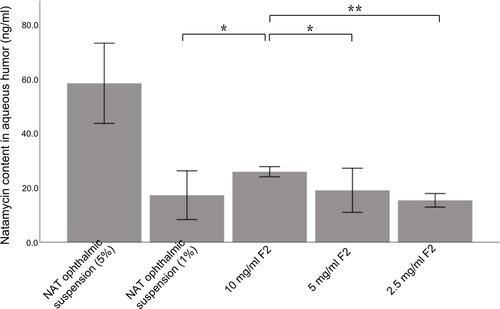
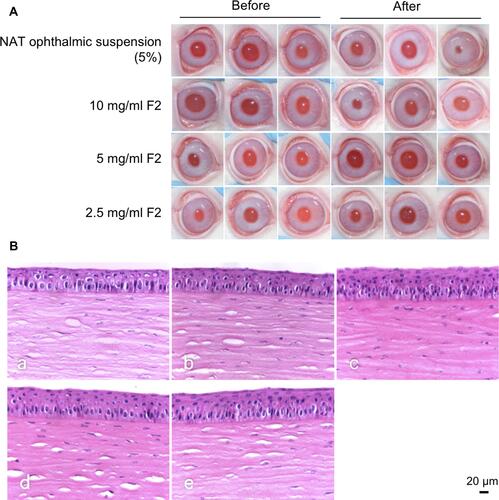
Figure 6 (A) Changes in the ocular surface at different time intervals during therapy. (B) Changes in the corneal ulcer area after treatment. (C) Changes in the clinical scores of keratitis after treatment. (D) Photomicrography of the histopathological study of the examined rabbit corneas. Infiltration of the inflammatory cells and neovascularization in the corneal stroma are indicated by arrows.
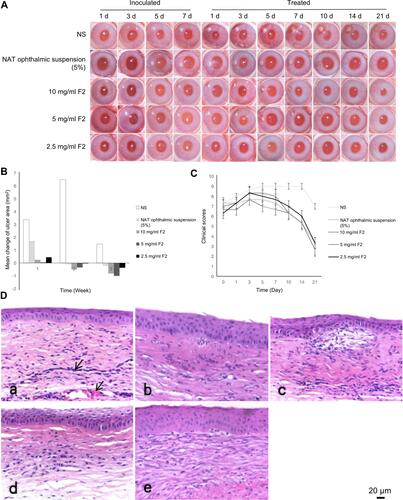
Figure 7 (A) Ocular surface retention time of the NAT ophthalmic suspension (5%) and different concentrations of F2. (B) Penetrating ability of different concentrations of F2 into the cornea.
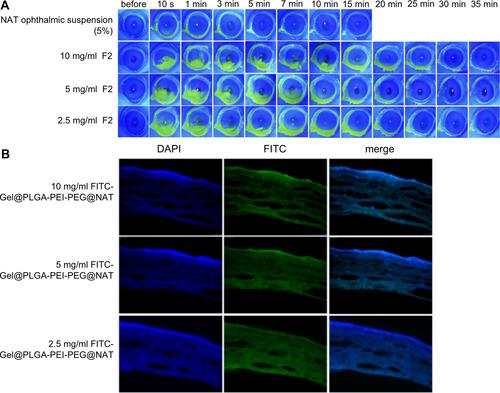
Figure 8 (A) Ocular surface changes after different drug administrations. (B) Photomicrography of the histopathological study of the examined rabbit corneas.