Figures & data
Figure 1 Schematic illustration of mechanisms and preparation of Cex-HSA/DOX/siMDR1. Cex-HSA/DOX/siMDR1 were prepared by the desolvation-crosslinking method, functionalization with cetuximab. After targeted into tumor tissues, Cex-HSA/DOX/siMDR1 could deliver DOX and siMDR1 into cells successfully, and DOX could be released to perform the antitumor effect.
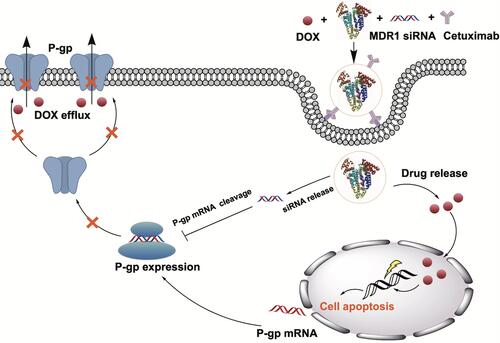
Table 1 Factors and Five Different Levels in CCD Design Experiment. HSA Concentration, pH Value, Volume of Ethanol and Speed of Ethanol Addition Were Selected for Multi-Factor Analysis to Obtain the Optimal Prescription for HSA Preparation. 5 Levels for Each Factors Were Designed by CCD-Response Surface Methodology (CCD-RSM)
Figure 2 Six single factors influence of the diameter and PDI and prescription optimization of HSA NPs and. (A) HSA concentration. (B) pH value. (C) Volume added ethanol. (D) Speed of ethanol addition. (E) Stirring rate. (F) 10% glutaraldehyde volume. (n=6).
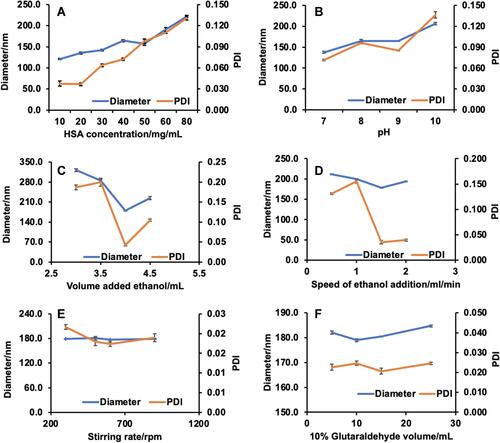
Figure 3 The optimal preparation of HSA NPs. The particle size, PDI and zeta potential of prepared HSA NPs were 178.280 ± 1.552 nm, 0.044 ± 0.006 and −35.760 ± 0.115 separately.
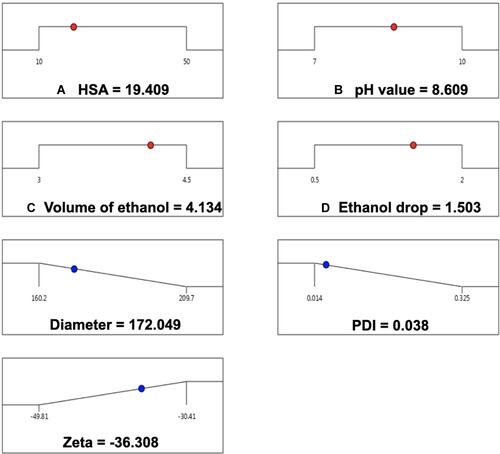
Table 2 Comparison of Experimental Actual Value and Predicted Value
Figure 4 Preparation and Characterization of Cex-HSA/DOX/siMDA1 NPs. (A) The drug loading and encapsulation efficiency of HSA/DOX with different mass ratios (n=3). (B) Agarose gel retardation assays of siMDR1 complexed with HSA/DOX. (C) The Diameter of HSA, H/D/M and C-H/D/M. (D) TEM images of the HSA, HSA/DOX, H/D/M and C-H/D/M. (E) Dispensability, stability, particle size, PDI. (F) Agarose gel retardation assay of anti-RNase A stability diagram of C-H/D/M.
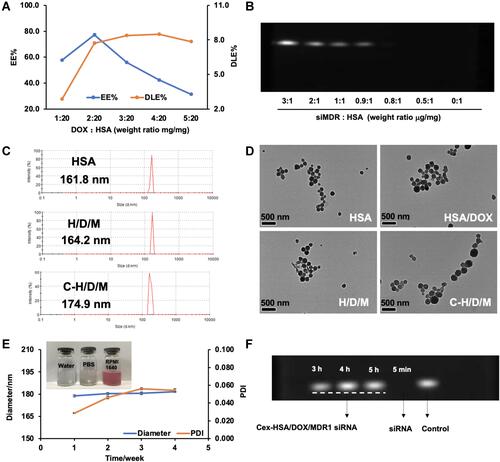
Figure 5 Intracellular delivery, safety of HSA and antiproliferation effect of C-H/D/M in vitro. (A) The drug resistance of MCF-7/ADR using MTT assays. (B) Confocal images of MCF-7/ADR cells treated with DOX, HSA/DOX, DOX+ Lipo/siRNA, H/D/X and C-H/D/M; siRNA was labled with Cy5 fluorescent molecule (red) to show the amount of siRNA into cells, the DOX were green and Hoechst 33342 (blue) for cell nucleus. (C) The cytotoxicity assays of HSA NPs on MCF-7/ADR cells. (D) Anti-proliferation effect of C-H/D/M in MCF-7/ADR cells. The data were presented as the mean ± SD, n=3.
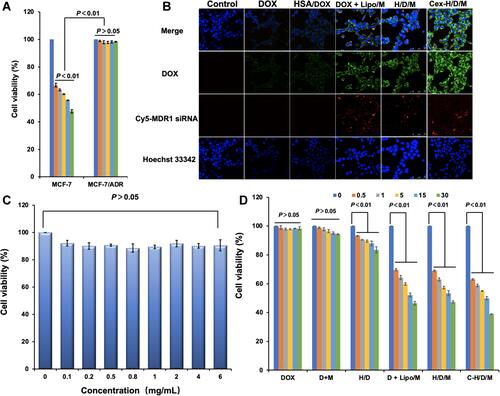
Figure 6 Cell apoptosis of MCF-7/ADR cells treated by C-H/D/M for 48 h and in vitro gene silencing effect. (A) Statistical chart of cell cycle distribution of MCF-7/ADR cells treated with different treatment groups. (B) The ATP level in MCF-7/ADR cells of different groups. (C) Distribution of MCF-7/ADR cell apoptosis detected by flow cytometry in different treatment groups. (D) MDR1-mRNA levels of the MCF-7/ADR cells treated with different siMDR1 formulations were tested by RT-PCR. (E) P-gp levels of the MCF-7 cells treated with different siMDR1 formulations were tested by ELISA assay. The cells with no treatment was considered as a control. The data were presented as the mean ± SD, n=3.
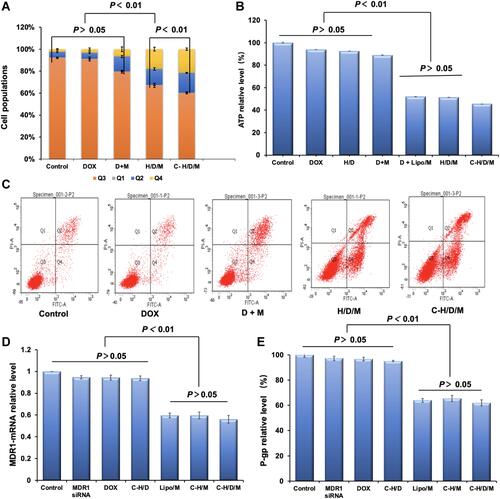
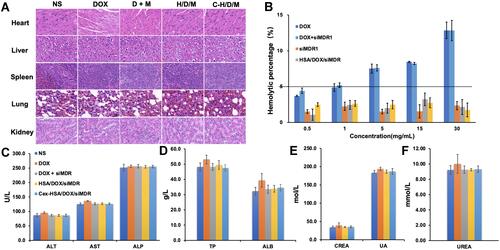
Figure 7 In vivo tumor therapeutic efficiency of C-H/D/M. (A) Tumor volume changes of mice were measured every two days. (B) Image of tumors collected from the mice on the day after the last injection. (C) H&E staining of MCF-7/ADR tumor tissues in nude mice injected with NS (Control), DOX, DOX+siMDR1, H/D/M, C-H/D/M. (100×). (D) The ratios of organ weight to body weight. The data were presented as the mean ± SD, n=6.
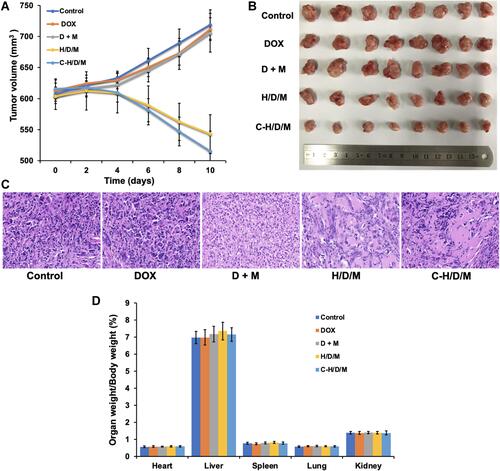
Figure 8 In vivo fluorescence image of different groups injected into tail of BALB/c nude mice. Images were taken at different time points after tail vein injection.
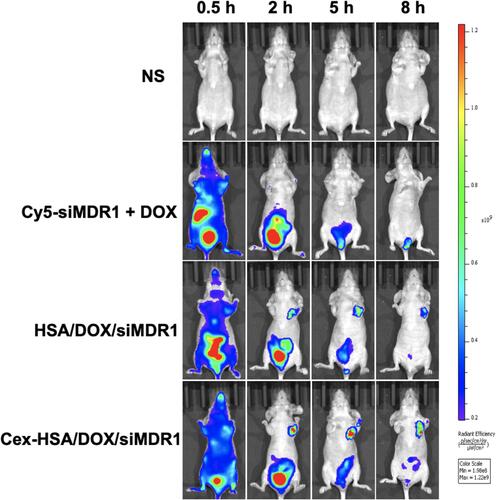
Table 3 Blood Routine Test
Figure 9 Biosafety of C-H/D/M in vivo. (A) H&E staining of the major organs from mice treated with NS (Control), DOX, DOX+siMDR1, H/D/M and C-H/D/M. (100×). (B) Hemolysis activity of C-H/D/M, hemolysis rate was evaluated in rat RBC. The data were presented as the mean ± SD, n=3. (C) Blood biochemistry data including liver function markers: ALT, AST, ALP. (D) Liver function markers: TB and ALB. (E) Kidney function markers: CREA, UA. (F) Kidney function markers: UREA. The data were presented as the mean ± SD, n=5.