Figures & data
Figure 1 Flow cytometry of washed platelets, presented as histograms (A), statistical presentation as box plots (B) and scatter plots (C), following 30 min incubation with increasing concentrations of nanoceria, showing dose-dependent rise in side scatter (SSC) (n=5, repeated measure ANOVA). (D) TEM images showing uptake and intracellular localization of nanoceria particles (marked with arrows) in platelet cytosol. (*p<0.05, ***p<0.001).
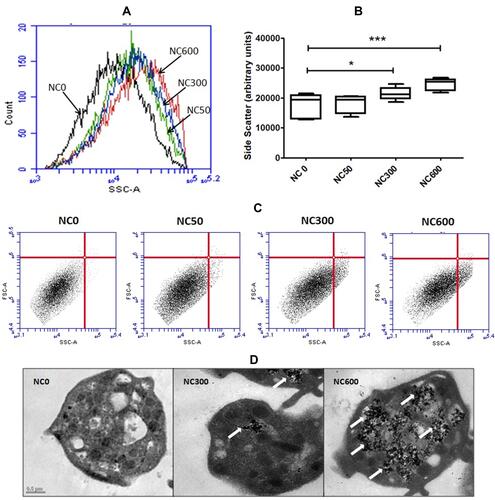
Figure 2 Thrombin (0.5 U/mL)-induced aggregation (A and B), ATP secretion (C) and P-selectin exposure (D) in washed platelets (2X10⁸ per mL) incubated for 30 min with and without nanoceria (n=6, repeated measure ANOVA). (E and F) thrombin-induced clot retraction in PRP (n=5, Repeated measure ANOVA). (*p<0.05, **p<0.01).
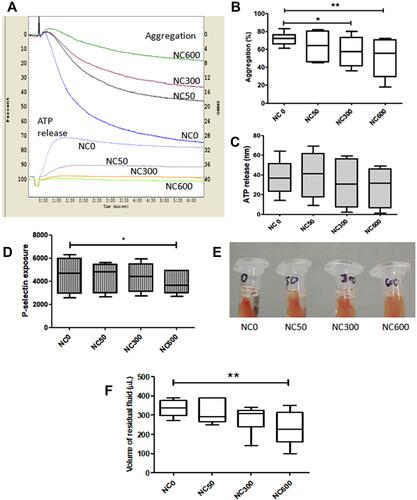
Figure 3 (A) Intracellular ROS in H2DCF-DA-stained platelets in absence (NC0) or presence of nanoceria (NC600) analysed by flow cytometry. PRP samples were incubated for 30 min with varying concentrations of nanoceria, followed by washing and staining with H2DCF-DA and treatment with thrombin or H2O2, as indicated. (B–D) box plots representing intracellular ROS level in resting platelets (B) (n=10), as well as in platelets following 5 min exposure with either 0.5 U/mL thrombin (C) (n=5) or 50 µM H2O2 (n=5), respectively (repeated measure ANOVA). (*p<0.05).
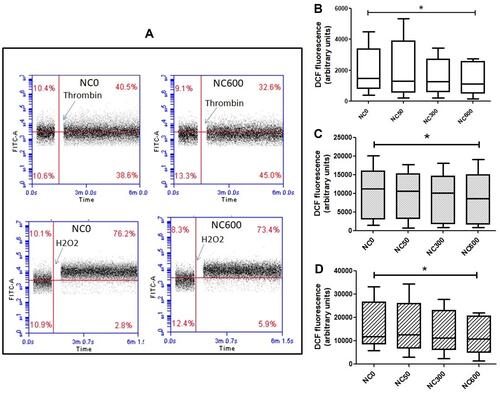
Figure 4 (A) decrease in F-actin content by nanoceria (dose NC600) in thrombin (0.5 U/mL)-stimulated washed platelets (2X10⁸ per mL) treated with phalloidin-FITC (2.5 μM) and analyzed by flow cytometry. Black tracing, resting platelets; red tracing, thrombin-stimulated platelets without nanoceria; and green tracing, thrombin-stimulated platelets after nanoceria (NC600) treatment. (B) box plots representing F-actin content as indicated (n=5, repeated measure ANOVA). (*p<0.05).
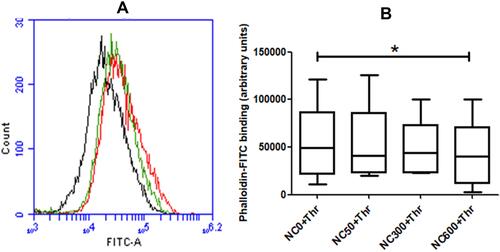
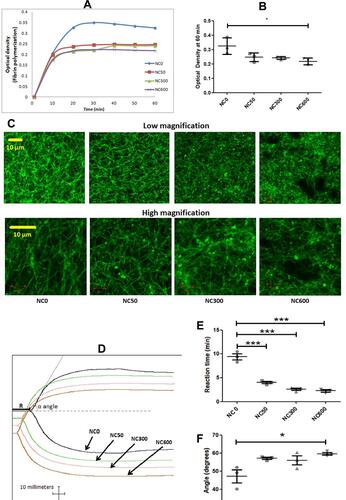
Figure 5 (A and B) nanoceria inhibited fibrin polymerization. (C) nanoceria disrupted normal morphology of fibrin polymer. (D-F) thromboelastogram of kaolin-stimulated citrated whole blood, without and with increasing doses of nanoceria, exhibiting reduction in reaction time and rise in speed of clot formation (Figures are representative of 3 independent experiments, compared by repeated measure ANOVA). (*p<0.05, ***p<0.001).