
Figures & data
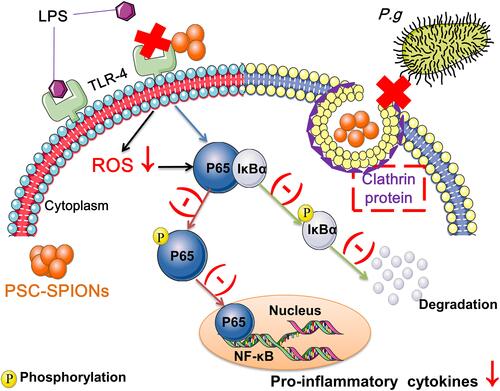
Table 1 Primer Sequences Used for hGF Gene Expression Analysis
Figure 1 Effect of polyglucose sorbitol carboxymethyl ether-superparamagnetic iron oxide nanoparticles (PSC-SPIONs) on the viability of human gingival fibroblasts (hGFs) and P. gingivalis (n = 5). (A) hGF viability was determined using Cell Counting Kit-8 assays after treatment with different concentrations of PSC-SPIONs for 24, 48, and 72 h. Data are presented as the mean optical density ± SD. (B) P. gingivalis colony numbers (%) after 25 μg/mL PSC-SPION treatment for 2 h with untreated P. gingivalis as the control. (C and D) Morphology of P. gingivalis after 25 μg/mL PSC-SPIONs treatment for 2 h (D) with untreated P. gingivalis as the control (C).
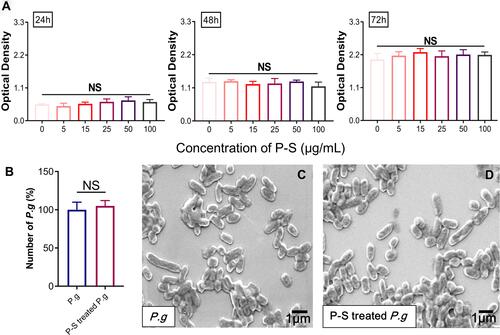
Figure 2 Anti-hGF-invasion effect of PSC-SPIONs on P. gingivalis. (A) Colony numbers of invading P. gingivalis in P-S treated hGFs (n = 3). (B) Confocal laser scanning microscopy images of 15-P-S-treated hGFs invaded by P. gingivalis (white arrows). Cell skeletal protein was stained with Alexa Fluor® 594 Phalloidin (red fluorescence). Nuclei were stained with DAPI (blue fluorescence). P. gingivalis were stained with SYTO-9 (green fluorescence). (C) Transmission electron microscopy (TEM) images of 15-P-S-treated hGFs invaded by P. gingivalis (red arrows). Structures resembling endocytic vesicles are marked by yellow arrows. **P < 0.01 compared with hGF+P. g control group.
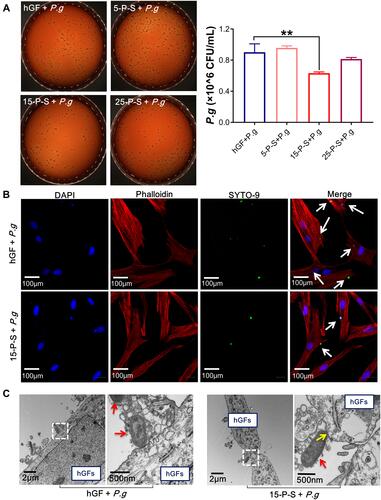
Figure 3 Effect of PSC-SPIONs on P. gingivalis lipopolysaccharide (LPS)-induced reactive oxygen species (ROS) production in hGFs. Inverted fluorescence microscopy images show cytoplasmic ROS in P-S treated hGFs stimulated by P. gingivalis LPS. Quantitative measurement of cytoplasmic ROS in P-S-treated hGFs stimulated by P. gingivalis LPS was performed using a multimode microplate reader. Data are presented as the mean ± SD (n = 3). ##P < 0.01 compared with hGF negative control; **P < 0.01 compared with hGF+LPS positive control.
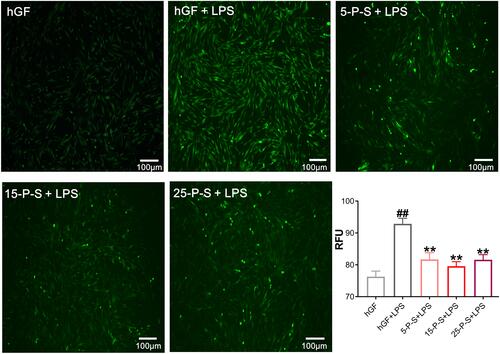
Figure 4 Effects of PSC-SPIONs on P. gingivalis LPS-induced inflammatory response in hGFs (A). IL-1β, TNF-α, IL-6, and IL-8 levels in P-S-treated hGFs stimulated by P. gingivalis LPS measured using enzyme-linked immunosorbent assays. (B) Gene expression (mRNA levels) of IL-1β, TNF-α, IL-6, IL-8, COX-2, and TLR-4 in P-S-treated hGFs stimulated by P. gingivalis LPS. Histograms show means ± SD from three independent experiments. ##P < 0.01 compared with hGF negative control group; *P < 0.05, **P < 0.01 compared with hGF+LPS positive control group.
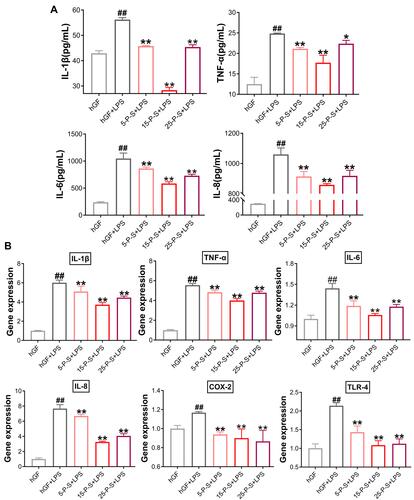
Figure 5 Effect of PSC-SPIONs on the NF-κB-p65 pathway. (A) Protein expression of p65, P-p65, IκBα, and P-IκBα in the cytoplasm of 15-P-S-treated hGFs stimulated by P. gingivalis LPS. (B) Protein expression of p65 in the nuclei of 15-P-S-treated hGFs stimulated by P. gingivalis LPS. Histograms show means ± SD from three independent experiments. #P < 0.05, ##P < 0.01 compared with hGF negative control; *P < 0.05, **P < 0.01 compared with hGF+LPS positive control.
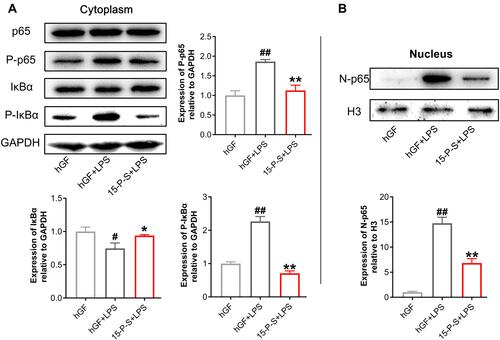
Figure 6 Effect of PSC on P. gingivalis LPS-induced inflammatory response in hGFs. Gene expression (mRNA levels) of IL-1β, TNF-α, IL-6, IL-8, and COX-2 were quantified in PSC-treated hGFs stimulated with P. gingivalis LPS using quantitative reverse transcription-polymerase chain reaction. Histograms show means ± SD from three independent experiments. ##P < 0.01 compared with hGF negative control; *P < 0.05, **P < 0.01 compared with hGF+LPS positive control.
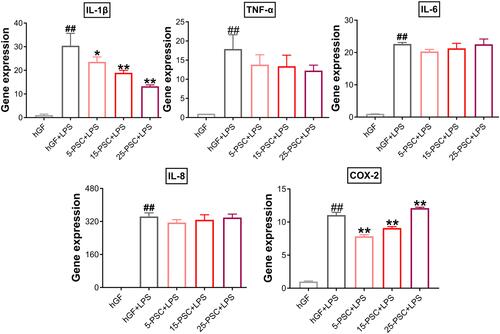
Figure 7 Effect of dimercaptosuccinic acid (DMSA)-SPIONs on P. gingivalis LPS-induced inflammatory response in hGFs. (A) Superconducting quantum interference device (SQUID) magnetometer magnetic hysteresis loops of PSC-SPIONs at 300 K. (B) TEM images of PSC-SPIONs and DMSA-SPIONs. (C) Gene expression (mRNA levels) of IL-1β, TNF-α, IL-6, IL-8, and COX-2 in D-S-treated hGFs stimulated with P. gingivalis LPS. Histograms show means ± SD from three independent experiments. ##P < 0.01 compared with hGF negative control; **P < 0.01 compared with hGF+LPS positive control.
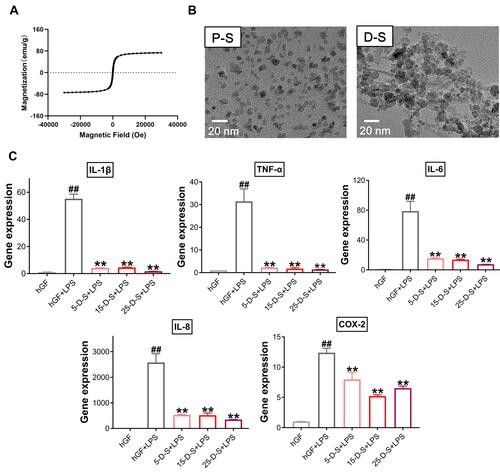
Table 2 Comparison of the Main Structural Parameters of PSC-SPIONs and DMSA-SPIONs