Figures & data
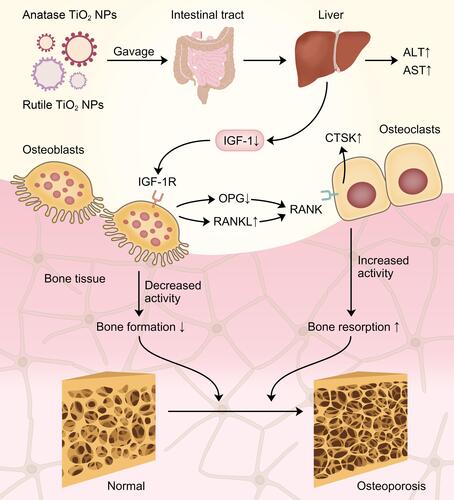
Figure 1 Characterization of TiO2 NPs. (A) TEM image of anatase TiO2 NPs. (B) TEM image of rutile TiO2 NPs. (C) SEM image of anatase TiO2 NPs. (D) SEM image of rutile TiO2 NPs. (E) Percent size distribution of anatase TiO2 NPs. (F) Percent size distribution of rutile TiO2 NPs.
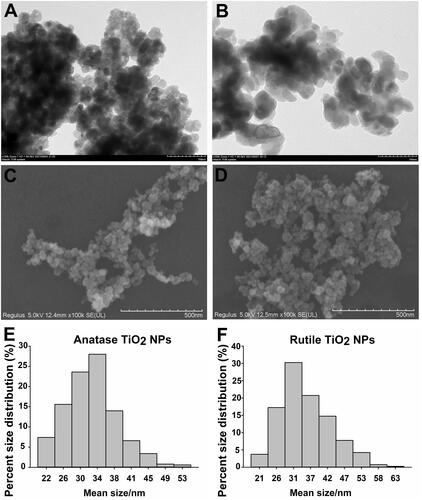
Figure 2 Growth characteristics. (A) Percent weight growth. (B) Body length. (C) BMI. (D) Tibia length.
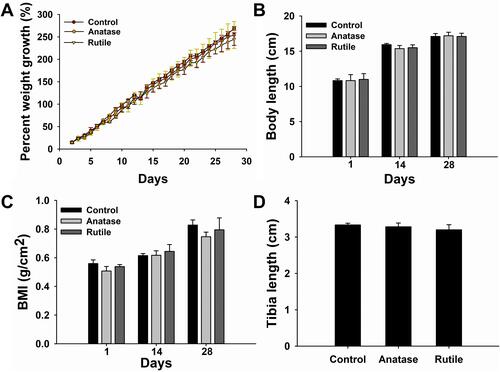
Figure 3 Analysis of serum biochemical indicators. (A) Liver function. (B) Concentration of Ca and P. (C) Ratio of Ca/P in serum. (D) Concentration of IGF-1. *P<0.05, **P<0.01 compared with control.
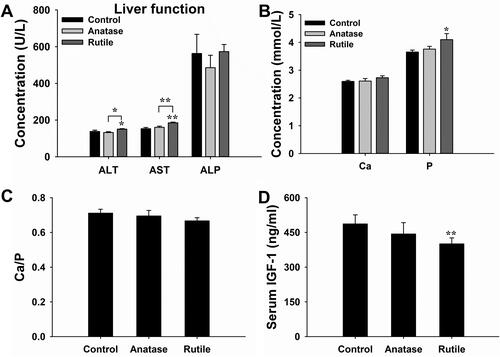
Figure 4 Non-reconstructed images of tibia. (A) Sagittal image of bone in the control group. (B) Sagittal image of bone in the anatase TiO2 NP group. (C) Sagittal image of bone in the rutile TiO2 NP group. (D) Cross-sectional image of bone in the control group. (E) Cross-sectional image of bone in the anatase TiO2 NP group. (F) Cross-sectional image of bone in the rutile TiO2 NP group.
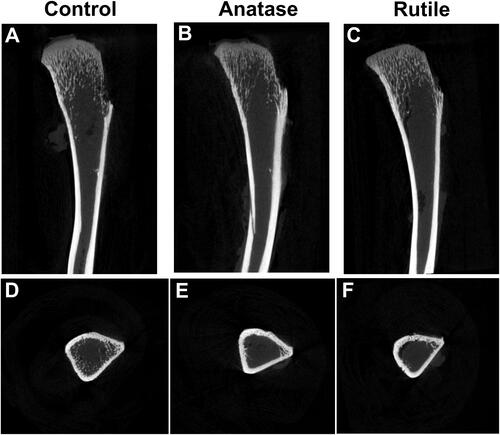
Figure 5 Three-dimensional images of tibia. (A) Cross-sectional image of trabecular bone in the control group. (B) Overall image of trabecular bone in the control group. (C) Sagittal image of bone in the control group. (D) Cross-sectional image of cortical bone in the control group. (E) Cross-sectional image of trabecular bone in the anatase TiO2 NP group. (F) Overall image of trabecular bone in the anatase TiO2 NP group. (G) Sagittal image of bone in the anatase TiO2 NP group. (H) Cross-sectional image of cortical bone in the anatase TiO2 NP group. (I) Cross-sectional image of trabecular bone in the rutile TiO2 NP group. (J) Overall image of trabecular bone in the rutile TiO2 NP group. (K) Sagittal image of bone in the rutile TiO2 NP group. (L) Cross-sectional image of cortical bone in the rutile TiO2 NP group.
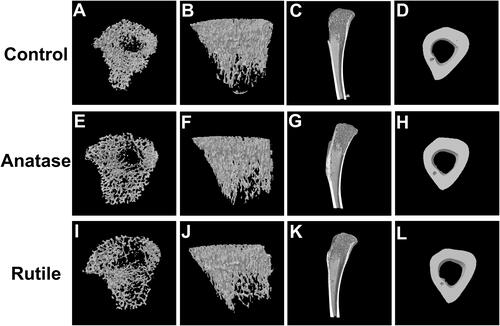
Figure 6 Morphological data of trabecular bone. (A) Bone mineral density (BMD, g/cm3). (B) Bone surface area (BS, mm2). (C) Connectivity density (Conn.Dn, 1/mm3). (D) Bone volume fraction (BV/TV, %). (E) Trabecular number (Tb.N, 1/mm). (F) Structure model index (SMI). (G) Bone surface area/bone volume (BS/BV, 1/mm). (H) Trabecular pattern factor (Tb.Pf, 1/mm). (I) Trabecular separation (Tb.Sp, mm). (J) Bone surface density (BS/TV, 1/mm). (K) Trabecular thickness (Tb.Th, mm).*P<0.05, **P<0.01 compared with control.
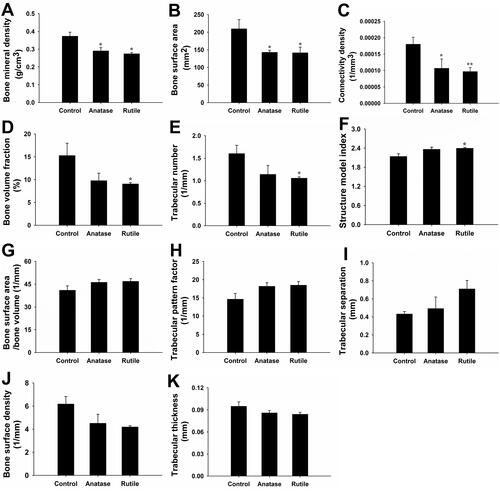
Figure 7 Morphological data of cortical bone. (A) Cross-sectional tissue area (T.Ar, mm2). (B) Cross-sectional tissue perimeter (T.Pm, mm). (C) Cross-sectional bone area (B.Ar, mm2). (D) Cross-sectional bone perimeter (B.Pm, mm). (E) Cross-sectional bone area/cross-sectional tissue area (B.Ar/T.Ar, %). (F) Cortical thickness (Ct.Th, mm).
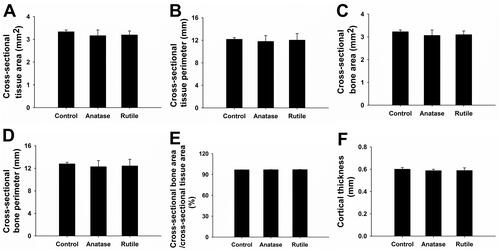
Figure 8 Bone immunohistochemical staining results. (A) OPG expression is colored brown-yellow in osteoblasts (200×, 400×). (B) RANKL expression is colored brown-yellow in osteoblasts (200×, 400×). (C) CTSK expression is colored brown-yellow in osteoclasts (200×, 400×). (D) Average integrated optical density (IOD) value of OPG expression in each group of tibia specimens. (E) Average IOD value of RANKL expression in each group of tibia specimens. (F) OPG/RANKL ratio. (G) Average IOD value of CTSK expression in each group of tibia specimens. a) Control, b) Anatase TiO2 NPs, c) Rutile TiO2 NPs (200×), d) Control, e) Anatase TiO2 NPs, f) Rutile TiO2 NPs (400×). *P<0.05, ***P <0.0001 compared with control.
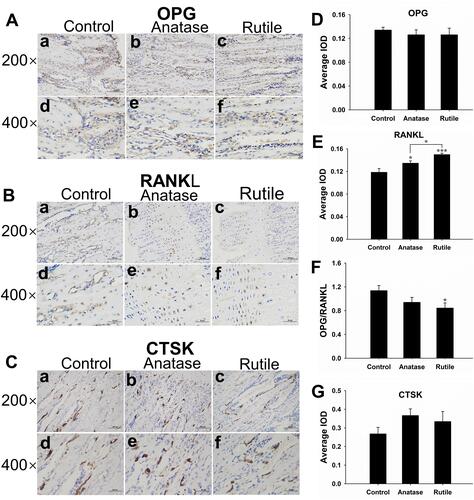
Figure 9 The schematic diagram for anatase and rutile TiO2 NPs damage bone structure in young rats via the IGF-1/OPG/RANKL/CTSK pathway. Data from these studies. Citation43,Citation44