Figures & data
Figure 1 Scanning electron microscopy (SEM) of the dental implant that was removed from the mandible bone due to chronic infection which developed soon after the surgery and could not be treated with conventional antibiotics. (A) Magnification of 30x does not show evident cause of implant failure, whereas magnification of 100x (B) and 500x (C) show bacterial biofilm persisting between implant screw threads. Source: own test results.
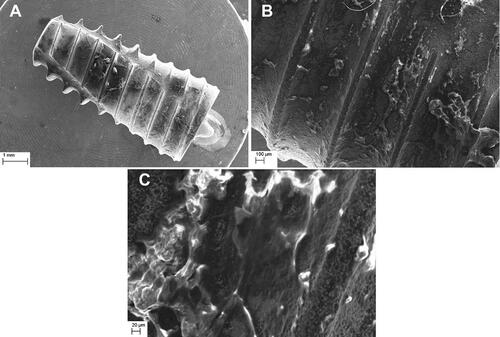
Table 1 Characterization of ZnO+0.1% Ag Nanoparticles
Figure 2 SEM image of ZnO+0.1% Ag nanoparticles used as implant coating (A–C). Images B(1) and B(2) as well as images C(1) and C(2) are images of identical areas of the sample that were taken using different detectors. (1) - SEM images taken with the InLens detector. (2) - SEM images taken with the AsB detector.
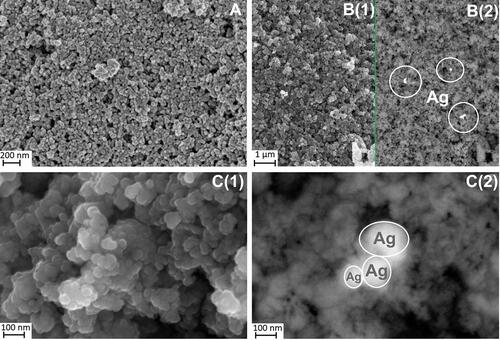
Figure 3 (A) Size distributions of particles/agglomerates of ZnO+0.1%Ag in human saliva suspension obtained by DLS method. (B) Crystallite size distribution of ZnO+0.1%Ag obtained by Nanopowder XRD Processor Demo, pre.α.ver.0.0.8, © Pielaszek Research.
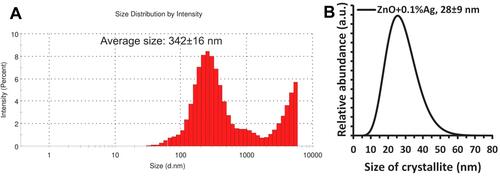
Figure 4 Comparison of SEM images of a pure implant abutment (A–C) and an implant abutment coated with ZnO+0.1% Ag (D–L).
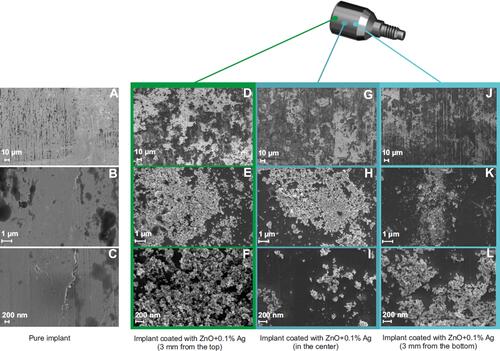
Figure 5 Elemental EDS mapping of a pure implant abutment (A–C) and an implant abutment coated with ZnO+0.1%Ag (D–F). There is a visible island coating of ZnO+0.1%Ag on the implant abutment surface.
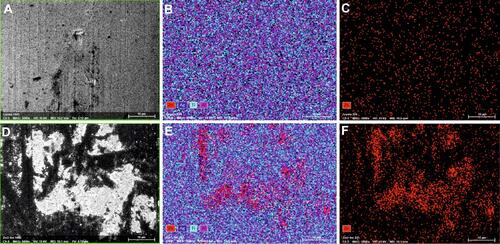
Figure 6 Qualitative EDS analysis of: (A) the clean implant surface consisting of C, Ti, Al and V; (B) surface of the modified implant abutment coated with ZnO+0.1%Ag. (1) - SEM image for EDS analysis area. (2) - EDS spectra.
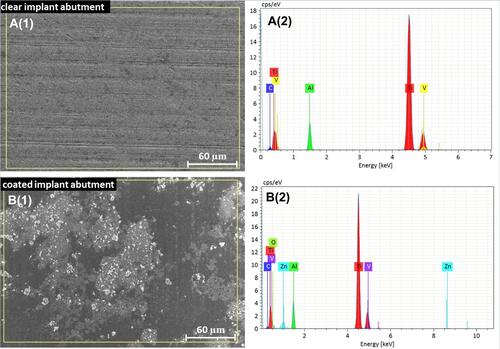
Figure 7 The example of AFM 3D images (10 μm x 10μm) of implant surfaces: (A) upper part of the pure abutment, (B) lower part of the pure abutment, (C) upper part of ZnO+0.1%Ag coated implant abutment, (D) lower part of ZnO+0.1%Ag coated implant abutment.
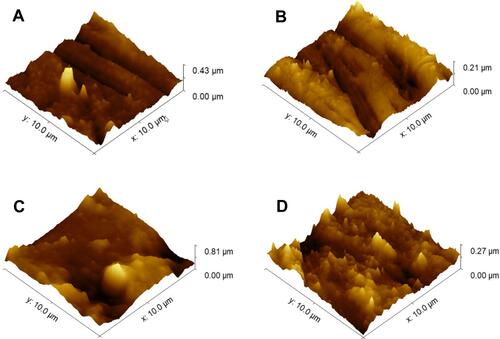
Figure 8 Example of contact angle analysis results (A) of the pure implant abutment surface and (B) of the implant abutment surface after modification with ZnO+0.1%Ag.
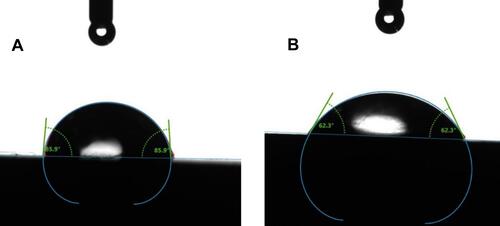
Figure 9 Absorbance test indicating a significant reduction in bacterial adhesion on the titanium surface modified with nanoparticles (p<0.005).
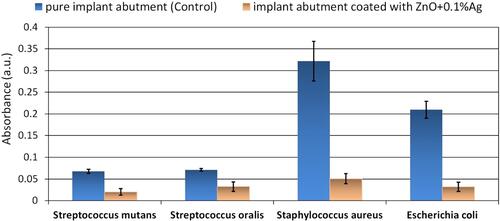
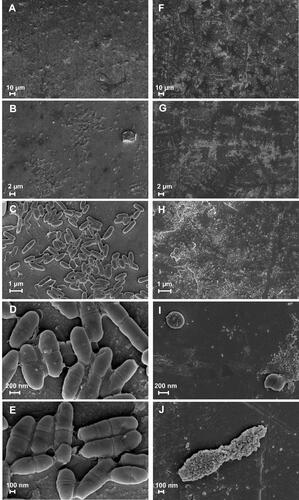
Figure 10 SEM image of the retrieved abutments after microbiological studies showing significantly more bacterial biofilm attached on the control implants (A–E) than those modified with ZnO+0.1%Ag NPs (F–J).