Figures & data
Figure 1 Schematic illustration of sEV preservation in GelMA hydrogels. sEV in PBS continuously move around in random patterns leads to particles aggregation, which resulted in membrane rupture (left). GelMA hydrogels could effectively limit the movement of sEV and reduce the aggregation to effectively preserve sEV. The preserved sEV were isolated for functional evaluation in vitro and UV-crosslinking sEV-GelMA complex system was adopted to compare the biological function of preserved sEV and fresh sEV in vivo (right).
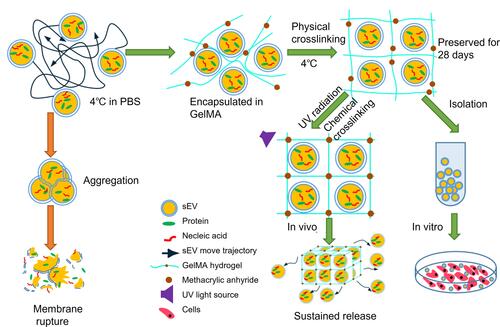
Figure 2 Analysis of sEV movement in GelMA hydrogels. (A) The pore size of GelMA hydrogels mixed with or without sEV, n = 3 each group (B) The tracks of sEV in PBS or 10%GelMA hydrogels during same time period at 4°C, Scale bar = 40μm. (C) Single particle track analyzed in 3D coordinate system. (D) The particles tracks speed of sEV in PBS or 10%GelMA hydrogels, n=20.The significance (A and D) was tested with one-way ANOVA with Tukey posthoc test. (**p < 0.01, ***p < 0.001).
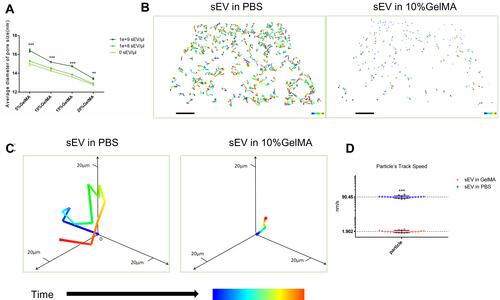
Figure 3 Characterization of sEV preserved in GelMA hydrogels. (A) sEV particle number preserved by different methods for different time, n = 3 each group. PC, positive control. (B) In vitro fluorescence image was used to evaluate the storage effects of different preservation methods for different days and (C) the fluorescence value, n = 3. (D) Average size of sEV particles preserved by different methods for different time, n = 3 each group. (E) Changes of particle size distribution of sEV preserved by different preservation methods. (F) TEM image for fresh sEV and sEV preserved by different preservation methods at 28 days. Scale bar = 100nm. (G) Western blot analysis of CD81 and CD9 in sEV preserved by different preservation methods. The significance (A, C and D) was tested with one-way ANOVA with Tukey posthoc test. (**p < 0.01, ***p < 0.001).
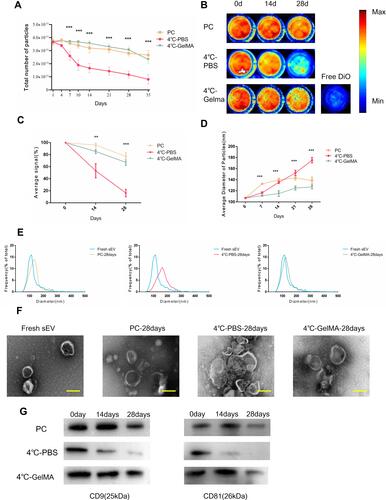
Figure 4 The effect of preserved sEV on HUVEC proliferation, migration, tube formation and angiogenesis differentiation. (A) Recovery rate of sEV from different preservation method by TEI isolation. (B) Proliferation of HUVEC co-cultured with fresh sEV and sEV preserved in GelMA hydrogels for 28 days. n = 3 for each group. (C) Images of migrated HUVECs in different group. Scale bar = 200μm. n = 3 for each group. (D) Images of scratch assay in different group. Scale bar = 100μm. Time transition of the percentage of cell-free zone against initial scratch area after 12 hour, n = 3 for each group. (E) Tube-like structures of HUVECs in different group. Scale bar = 200 µm. n = 3 for each group. (F) The expression of angiogenesis markers (VEGF, FGF2, CD31, Angiogenin) was detected by qRT-PCR at 4 days post sEV treatment, n = 3 for each group. The significance (A–E) was tested with one-way ANOVA with Tukey posthoc test. (*p < 0.05, **p < 0.01, ***p < 0.001).
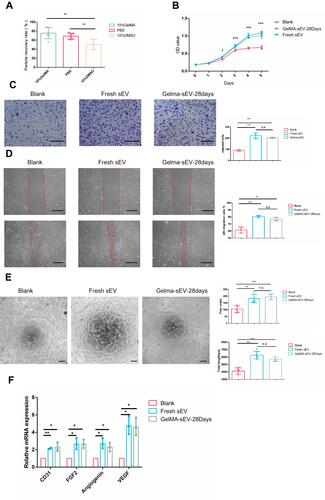
Figure 5 sEV could be controlled released from sEV-GelMA complex after preservation in vivo. (A) General view of different UV-crosslinking time for preserved GelMA-sEV complex (B) Viscosity of different UV-crosslinking time GelMA-sEV complex dressing with the shear rate from 0.1 to 10 1/s. (C) Rheological behavior of different UV-crosslinking time GelMA-sEV complex was evaluated via rheometer. The significance was tested with repeated measurement data analysis of variance (MANOVA). (D) General view and schematic view of the experimental operation in vivo. (E) Ex vivo visualization of red fluorescent labeled GelMA hydrogels UV-crosslinked by different time period for 6 days. (F) Ex vivo visualization of DiO labeled sEV encapsulated in GelMA hydrogels UV-crosslinked by different time period for 6 days. (G) Quantification analysis of the fluorescence intensity for red fluorescent labeled GelMA hydrogels and DiO labeled sEV with different crosslinking time. The correlation coefficient R and significance of was calculated by linear correlation analysis. (***p < 0.001).
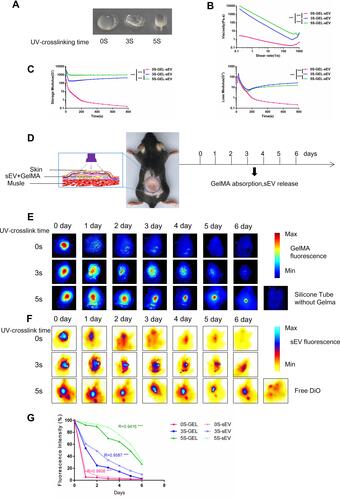
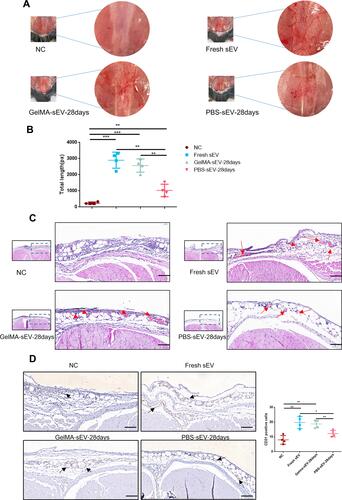
Figure 6 Preserved GelMA-sEV complex promoted angiogenesis in the subcutaneous fascial layer of C57BL/6J mice. (A) General view of angiogenesis in the subcutaneous fascial layer in different groups on 6th day after treatment.NC, negative control. (B) Total length of new vessels in the fascial layer from each groups, n = 4. (C) Representative HE-stained images of angiogenesis in the subcutaneous fascial layer (red arrows: new vessels with erythrocytes) Scale bar = 50µm. (D) Immunohistochemical staining of CD31-positive endothelial cells in each groups was used to visualize vessels. CD31-positive endothelial cells were quantified from 5 independent visions per sample (black arrows: CD31 positive endothelial cells) Scale bar = 50 µm, n = 4. The significance (A and D) was tested with one-way ANOVA with Tukey posthoc test. (*p < 0.05, **p < 0.01, ***p < 0.001).