Figures & data
Table 1 Primers Used in the Study
Figure 1 Schematic of the direct detection of pulmonary fibrosis by biomimetic platelets PVD.
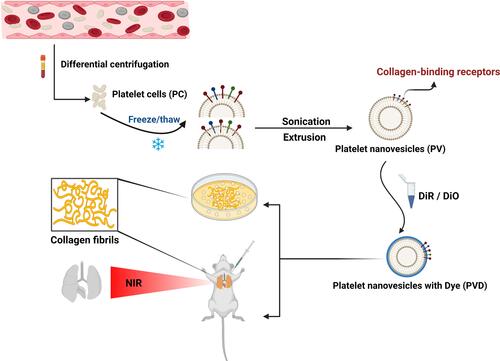
Figure 2 Characterization of PVD. (A) The morphology of purified platelets being observed under a light microscope. Scale bar = 50 μm. (B) TEM image of platelet-derived nanovesicles. Scale bar = 100 nm. (C) DLS analysis of PV and PVD. (D) Surface zeta potentials of PV and PVD (n=3). (E) SDS-PAGE analysis of surface proteins on PC, PV and PVD.
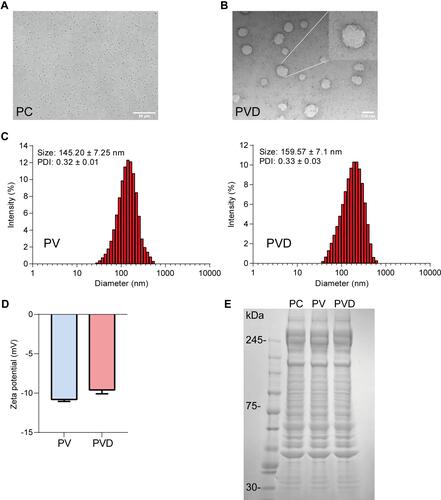
Figure 3 Characterization of a rat model of MCT-induced pulmonary fibrosis. (A) Schematic of the animal study to establish and monitor the disease progression of the PF rat model. (B) Representative tissue sections stained with HE, Masson’s Trichrome and Sirius red showed that rats with 4-weeks of MCT-induction displayed inflammatory infiltration and fibrosis in the lungs. Scale bar = 100 μm. (C) The quantitative analysis showed that the fibrosis area had increased significantly in MCT-4W rats (n=5). (D) The mRNA expression of type I and type III collagen was markedly up-regulated in MCT-4W rats (n=5). (E) Representative tissue sections stained with Masson’s Trichrome showed that rats with 2-, 3- and 4-weeks of MCT-induction displayed time-dependent increasing fibrosis in the lungs. (F) The collagen and hydroxyproline contents in lung homogenates of rats with 2-, 3- and 4-weeks of MCT-induction were determined (n=6). *P<0.05, ****Denote p < 0.0001, ns, not significant. Two-tailed Student’s t test in (C and D), and one-way ANOVA followed by Dunnett test in (F).
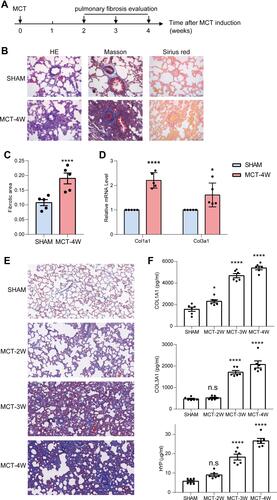
Figure 4 In vitro collagen-targeting tests of PVD. (A) PVD and three controls (PBS, DiR dye and RVD) were incubated in collagen-coated microplates and washed thoroughly. Afterward, the fluorescence intensity of substrates retained in microplates was measured. Only PVD showed strong and specific collagen association (n=4). (B) PVD was incubated in collagen-coated microplates with different collagen fibril densities, and pure PBS was used as a collagen-free control. The rest of the procedure was the same as in (A). PVD showed specific and dose-dependent collagen association (n=5). ns, not significant, *Denotes p < 0.05, ***Denotes p < 0.001 and ****Denotes p < 0.0001 by One-way ANOVA followed by Dunnett multiple comparisons test with PBS group.
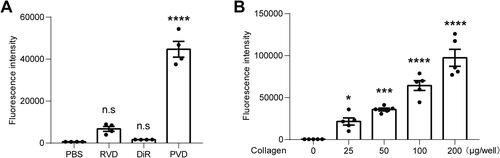
Figure 5 In vivo and ex vivo pulmonary fibrosis detection by PVD. (A) Representative images of fluorescence distribution in vivo of PF rats with 4-weeks of MCT-induction and SHAM rats when injected with PVD. The black dotted circle indicates the approximate location of the lungs. PBS, RVD and DiR dye were used as controls (n=3). (B) Representative images of ex vivo fluorescence of major organs isolated from the same rats used in (A) as indicated. (C) Quantification of ex vivo fluorescence intensity of lung tissues isolated from the same rats used in (A) as indicated (n=3). ns, not significant, **Denotes p < 0.01 by Kruskal–Wallis test followed by Dunn’s multiple comparisons with SHAM + PBS group.
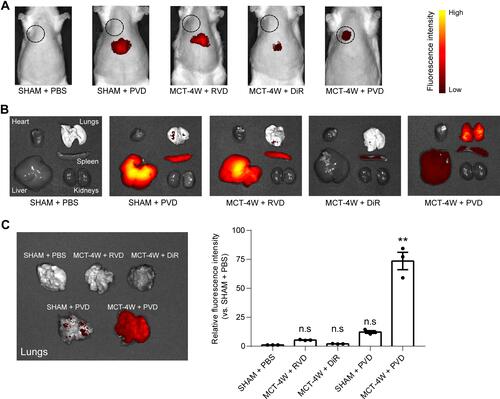
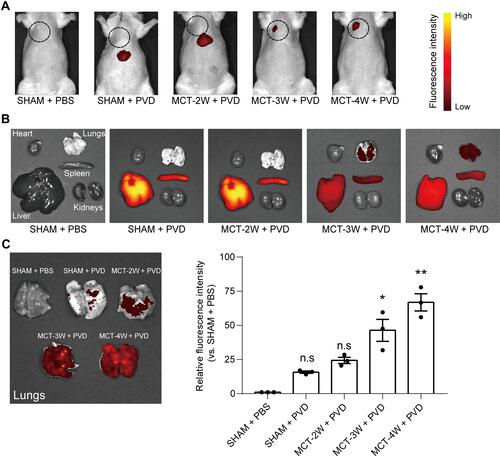
Figure 6 The sensitivity of PVD to detect PF with different levels of fibrosis. (A) Representative images of PVD fluorescence distribution in vivo of PF rats with 2-, 3- and 4-weeks of MCT-induction (n=3). The black dotted circle indicates the approximate location of the lungs. (B) Representative images of ex vivo fluorescence of major organs isolated from the same rats used in (A) as indicated. (C) Quantification of ex vivo fluorescence intensity of lung tissues isolated from the same rats used in (A) as indicated (n=3). ns, not significant, *Denotes p < 0.05 and **Denotes p < 0.01 by Kruskal–Wallis test followed by Dunn’s multiple comparisons with SHAM + PBS group.