Figures & data
Scheme 1 A schematic diagram of the experimental process with (A) the nanoparticle synthesis using a thermal decomposition method, (B) the nanoparticle coating with PEG polymers to make them biocompatible and (C) the uptake of the nanoparticles in the cells after incubation and washing. The diagram was made using Chemdraw software.
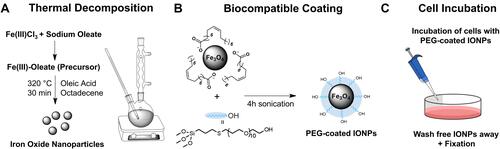
Figure 1 (A) TEM images of OA-IONPs in heptane. (B) Magnified area of the TEM image showing the OA-IONPs. (C) Size distribution of 11.3 ± 4.5 nm obtained by analyzing around 3000 particles with ImageJ.
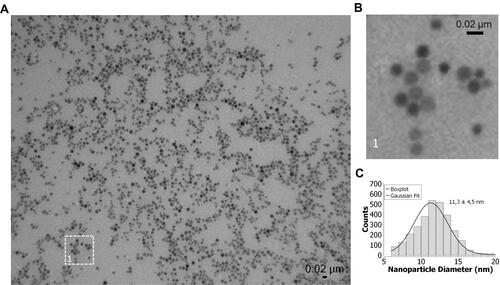
Figure 2 (A) FT-IR spectra of OA-IONPs and PEG-coated IONPs, (B) Powder XRD profiles for PEG-coated IONPs and the theoretical values for magnetite (JCPDS file no. 19–0629) and maghemite (JCPDS file no. 39–1346), (C) DLS measurement of PEG-coated IONPs, (D) M–H curve of PEG-coated IONPs at different temperatures.
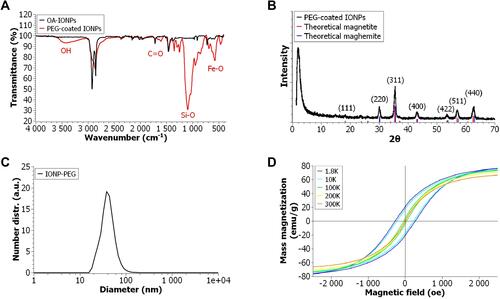
Figure 3 (A) Relaxation rate Ri (Ri = 1/Ti) over Fe concentration of the PEG-coated IONPs in solution. The slope indicates the specific relaxivity (ri), which values have been converted to mM−1 s−1 using the molar mass of iron (M = 55.845 g/mol). (B) Top row: T2-weighted MR images of increasing PEG-coated IONP concentrations, and row 2 to 4: color-coded T1, T2 and T2* relaxation times with increasing PEG-coated IONP concentrations.
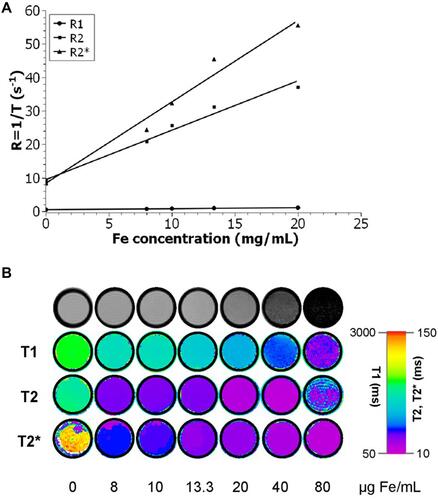
Figure 4 (A) One-photon and (B) two-photon emission spectra of PEG-coated IONPs (0.01 mg/mL) dispersed in water at different excitation wavelengths. (C) Proposed Jablonski diagram for the PEG-coated IONP emission properties.
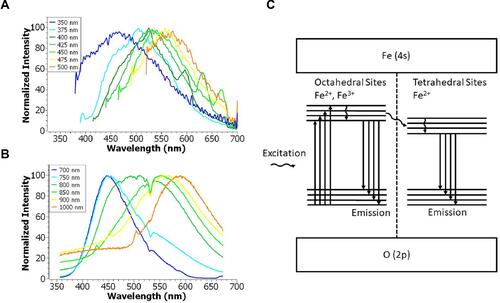
Figure 5 Prussian Blue staining of labeled A549 cells with 50 and 100 µg/mL at 24 and 72 h of incubation. The black arrows point to NPs inside the cells. The black arrows point to PEG-IONPs embedded in vesicles inside the cells. Images at 72 h of incubation with PEG-IONP showed a clear increase of the nanoparticles cellular uptake.
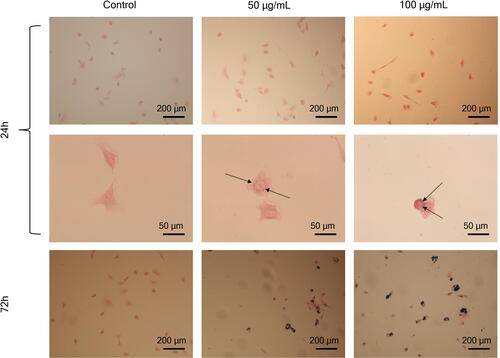
Figure 6 Trypan blue exclusion cytotoxicity assay of (A) A549 cells, (B) BEAS-2B cells and (C) GRX cells incubated with PEG-coated IONPs at different concentrations for different exposure times (24h, 48h and 72h). Data was collected from two independent experiments with three replicates per sample and analyzed with Two-Way ANOVA with Bonferroni post-Hoc test. Concentration effect (P>0.05); Day effect (P>0.05); Interaction (P>0.05).
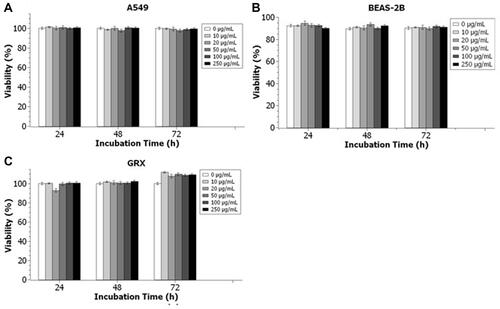
Figure 7 T2 relaxation time of A549 cells labeled with PEG-coated IONPs as a function of the Fe concentration. Error bars indicate standard deviations of experiments repeated in triplicates.
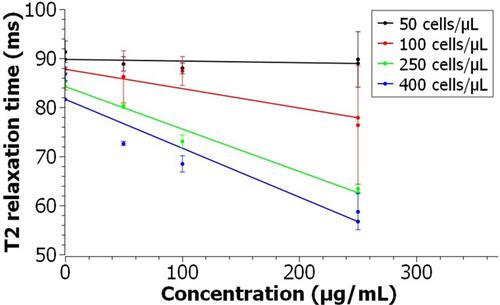
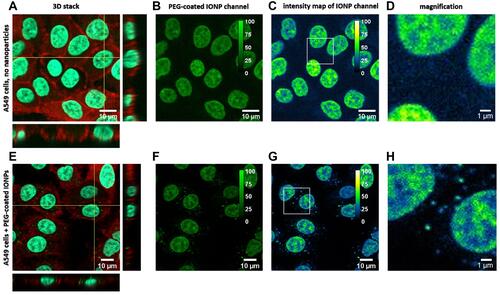
Figure 8 Two-photon fluorescence images of A549 cells incubated for 72 h without IONPs as a control (A–D). (A) Channel overlay, (B) IONP channel and (C) intensity range map of the IONP channel, with magnified area (D). A549 cells after 72 h incubation with PEG-coated IONPs (E–H). (E) Overlay of the 3 channels with the IONPs in green, the nucleus in cyan and the cytoskeleton in red. (F) IONP detection channel only and (G) Intensity range map from the IONP channel together with (H) a magnified area, indicating the presence of IONPs (calibration bar in the top right).