Figures & data
Table 1 Primer Information of RT-qPCR
Figure 1 (A–C) TEM images of DMSNs-NH2. (D) Particle diameter distribution of DMSNs-NH2. (E) N2 adsorption-desorption isotherm of DMSNs-NH2. (F) Pore diameter distribution of DMSNs-NH2. (G) Zeta potentials of the DMSNs, DMSNs-NH2, and DMSNs-NH2-ASvicR in deionized water. (H) The schematic diagram of DMSNs-NH2 synthesis process: the DMSN precursor was synthesized one-pot biphase stratification approach, then the cationic surfactant was removed by the hydrochloric acid ethanol solution to obtain DMSN, and the DMSN is aminated by APTES to obtain DMSN-NH2.
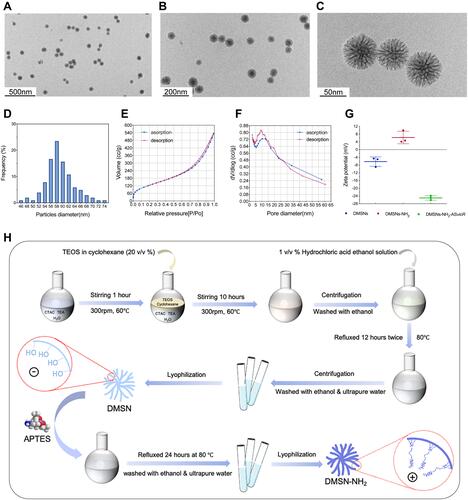
Table 2 Data of Loading Curve
Figure 2 (A) Agarose gel electrophoresis after different concentrations of DMSNs-NH2 interacted with plasmid-ASvicR. The red arrow indicates open-loop form of the plasmid-ASvicR, and the yellow arrow indicates supercoiled form of the plasmid-ASvicR. (B) The graph of DMSNs-NH2 loading plasmid-ASvicR with different weight ratio. (C) Agarose gel electrophoresis after various weight ratios of DMSNs-NH2/plasmid-ASvicR incubated with 1μL DNase I for 15 minutes. (D) Agarose gel electrophoresis of the plasmid-ASvicR released by heparin after incubation with the DNase I. (E) EDS-mapping images of DMSNs-NH2 and DMSNs-NH2-ASvicR with sacle bar of 100 nm. Si represents silicon in DMSNs-NH2 and P represents phosphorus in plasmids-ASvicR. (F) Schematic diagram of the plasmid-ASvicR loaded and protected by DMSNs-NH2. The negatively charged plasmids-ASvicR were adsorbed in the mesopores of the positively charged DMSNs-NH2, thereby avoiding degradation by DNase I.
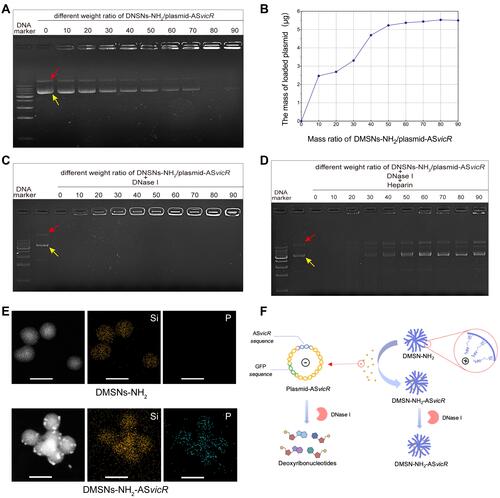
Figure 3 (A) UA159 were cultured with deionized water, plasmid-ASvicR, DMSNs-NH2-ASvicR respectively for 30 min, 3h, 6h, 12h, and 24h, the mixed solution was coated onto the BHI solid medium added with spectinomycin, and the colony growth was observed after 48h of culture. (B) The expression of GFP in UA159 added with deionized water, pDL278 (the plasmid without ASvicR sequence and GFP), DMSNs-NH2, plasmid-ASvicR and DMSNs-NH2-ASvicR. (C) The fluorescence intensity of the group treated with plasmid-ASvicR and DMSNs-NH2-ASvicR; **P < 0.01, n = 3.
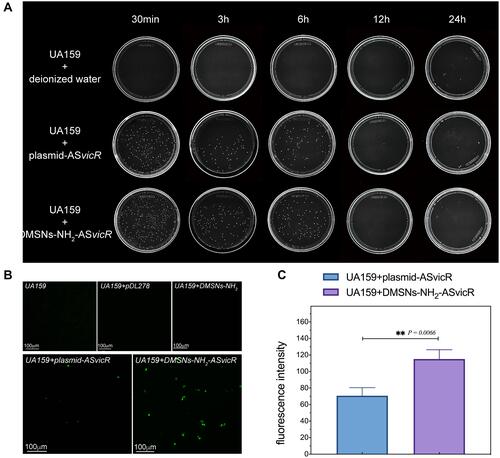
Figure 4 Scanning electron micrograph of biofilms in which S. mutans UA159 were treated with deionized water, pDL278, plasmid-ASvicR, DMSNs-NH2, and DMSNs-NH2-ASvicR thrice and developed in brain heart infusion (BHI) supplemented with 1% sucrose for 12 hours and 24 hours. The partial enlarged view of the 24-hour biofilm in the DMSNs-NH2-ASvicR group shows that nanoparticles clustered around S. mutans, and some nanoparticles even directly contacted the surface of Streptococcus mutans.
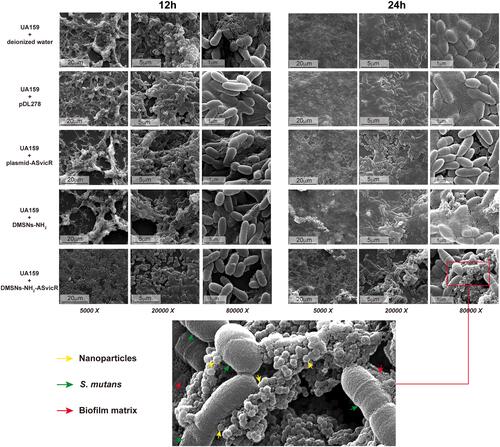
Figure 5 (A and D) Double labeling image and three-dimensional visualization of EPS (red) and bacteria (green) in S. mutans biofilms after treated with deionized water, pDL278, plasmid-ASvicR, DMSNs-NH2, and DMSNs-NH2-ASvicR thrice respectively and developed in brain heart infusion (BHI) supplemented with 1% sucrose for 12 hours and 24 hours. (B and E) Quantitative data of bacterial and EPS biomass; **P < 0.01, ***P < 0.001, and ****P < 0.0001, n = 6. (C and F) Volume ratio of the exopolysaccharide (EPS) matrix to the bacterial biomass in biofilms.
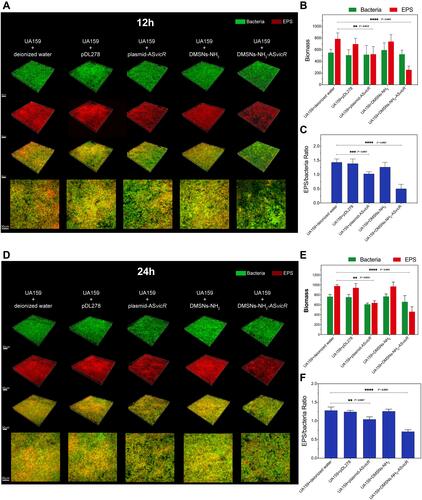
Figure 6 (A) qRT-PCR analysis of the vicR expression using gyrA as a reference gene and the group “UA159+deionized water” as control; **P < 0.01 and ****P < 0.0001, n = 4. (B) The working model of DMSNs-NH2-ASvicR entering S. mutans and regulating biofilm formation.
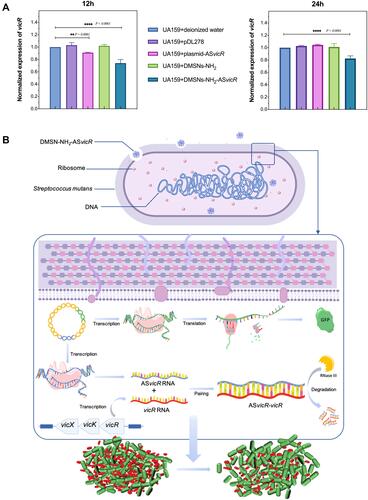
Figure 7 (A) Live/dead staining of Human gingival fibroblasts (HGFs) after 24 hours of incubation with different concentrations of DMSNs-NH2-ASvicR. (B) Excluding the influence of DMSNs-NH2-ASvicR on absorbance. (C) CCK-8 assay of human gingival fibroblasts (HGFs) treated by different concentrations of DMSNs-NH2-ASvicR; n = 4.
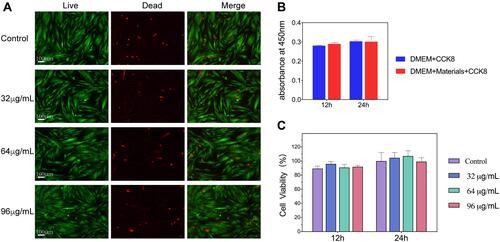
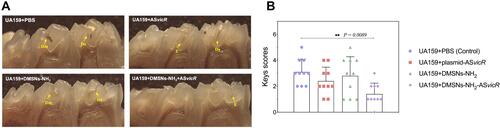
Figure 8 (A) Stereoscopic microscopy of pit fissure caries lesions on mandibular molars of rats. (B) Total Keys scores of caries on the first and second mandibular molars of rats. **P < 0.01, n = 10.