Figures & data
Figure 1 Synthesis of PBAE546. 1.5-Pentanediol diacrylate (B5) was mixed with 4-amino-1-butanol (S4) and stirred on a magnetic stir plate at 90 °C for 24 h. 2-(3-aminopropylamino)ethanol (E6) was added to the mixture and stirred to form the PBAE546.
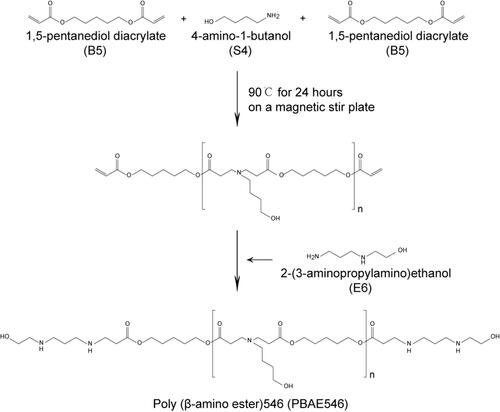
Figure 2 Characterization of NPs. (A) Agarose electrophoretic gel of NPs composed of GFP and PBAE546 with different mass ratios. (B) Particle sizes and PDI and (C) zeta potentials of NPs with different mass ratios (PBAE546:GFP) measured by dynamic light scattering. The data represent the mean ± SD (n = 3 per group). One-way ANOVA was used for statistical analysis, *P < 0.05, **P < 0.01, ***P < 0.001, ****P < 0.0001.
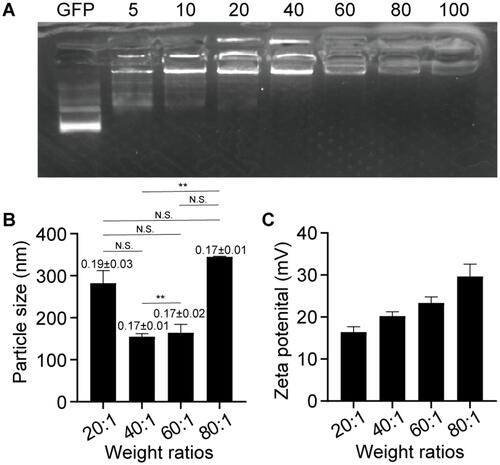
Figure 3 Uptake of NPs by cell lines and mouse uterine cervixes. (A) Representative images of SiHa, HeLa, S12, CaSki, MS751, and HEK293 cells 72 h after treatment with NPs (PBAE546/GFP 60:1). (B) Statistical uptake efficiency of PBAE546/GFP NPs with different weight ratios (20:1, 40:1, 60:1, and 80:1) compared with that of HP/GFP (1:1) by flow cytometry. (C) Representative images of fluorescence in the uterine cervixes of C57BL/6 mice treated with NPs (PBAE546/RFP, weight ratio 60:1, 10 μg RFP once per day for three days) compared with control cervixes treated with NP-free 25 mM sodium acetate. Scale bar, 20 μm. One-way ANOVA was used for statistical analysis, *: P < 0.05, **P < 0.01, ***P < 0.001, ****P < 0.0001.
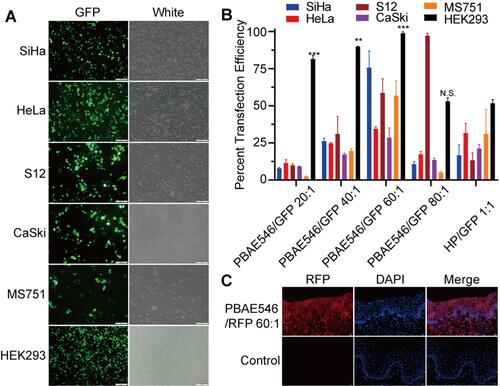
Figure 4 Analysis of NPs toxicity in cell lines and mouse organs. (A–D) The cytotoxicity of NPs composed of PBAE546/GFP with different mass ratios (20:1, 40:1, 60:1, and 80:1) was detected in (A) SiHa, (B) HeLa, (C) S12, and (D) CaSki cell lines. bPEI/GFP(3:1) was used as the positive control. Toxicity is given as the viability of the cells remaining after treatment for 0h, 24h, 48h, and 72 h. Each point represents the mean ± SD (n = 3). (E) Representative images of H&E-stained paraffin sections of cervix and liver tissues harvested from mice treated with NPs consisting of PBAE546/GFP (60:1) and bPEI/GFP (3:1) for 10 days and 20 days. The volume of NPs in the vagina of the treated mice was 10 μL, containing 10 μg of plasmid. Vaginal treatment was performed once a day for 20 consecutive days. (F) NPs generated by PBAE546/GFP (60:1) and bPEI/GFP 1 (3:1) were injected into the thigh muscle of mice for three consecutive days. Representative images of H&E-stained paraffin sections of thigh muscle tissue and liver tissue of mice harvested on the fourth and seventh days after the first injection. A total volume of 100 μL of NPs containing 100 μg of plasmid was injected into the thigh muscles of mice each day. Scale bars, 20 μm.
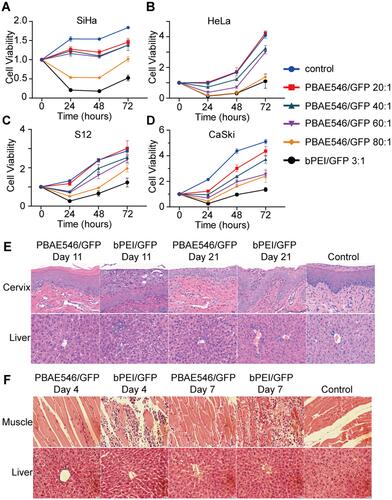
Figure 5 Growth inhibition of cervical cancer cells by PBAE546–therapeutic plasmid polyplex NPs in vitro and in vivo. (A–C) The CCK-8 method was used to detect the viability of (A) SiHa, (B) S12, and (C) CaSki cells at 24 h, 48 h, and 72 h after treatment with NPs (PBAE546/plasmid 60:1) composed of PBAE546 and CRISPR/Cas 9 plasmid targeting HPV16 E7. One-way ANOVA was used for statistical analysis, *: P < 0.05, **: P < 0.01, ***: P < 0.001, ****: P < 0.0001. (D-E) SiHa cells were injected subcutaneously into the right hind limb of BALB/c-nu mice. When the transplanted tumor grew to approximately 35 mm3, NPs consisting of PBAE546 and the CRISPR/Cas9 plasmid targeting HPV16 E7 were injected intratumorally (60:1). NPs were injected as a volume of 100 µL containing 60 μg of plasmid once every four days. (D) The subcutaneously formed tumors were photographed, and (E) the estimated sizes were measured after treatment with NPs.
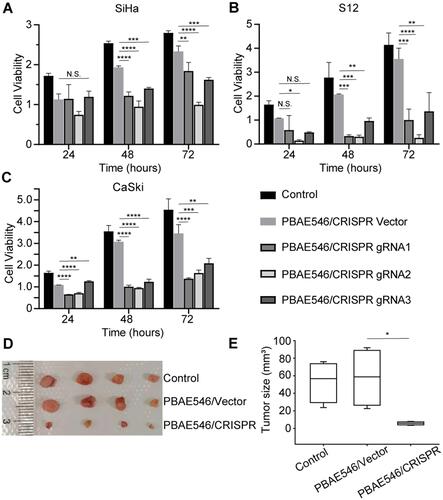
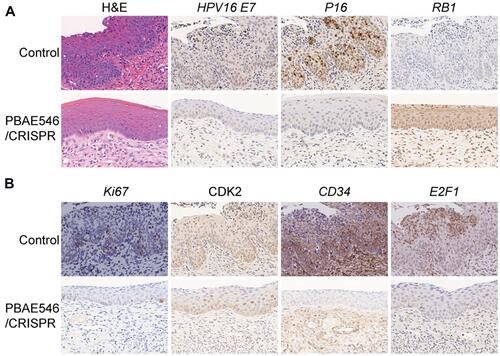
Figure 6 Therapeutic effect of NPs composed of PBAE546 and CRISPR/Cas9 recombinant plasmids targeting HPV16 E7 in the vaginas of HPV16 transgenic mice. (A and B) Representative images of H&E and IHC staining of the cervical epithelium between the HPV16 transgenic mouse control group and the HPV16 E7 NPs (PBAE546/plasmid 60:1, 10 μg of plasmid per day for 20 days) treatment group. IHC staining indicators included HPV16 E7, P16, RB1, Ki67, CDK2, CD34 and E2F1. Scale bars, 20 μm.