Figures & data
Figure 1 Representative snapshots of insertion of the HA-FD-13 peptide into an armchair (20,20) CNT at various times. For clarity, molecules of water have not been shown.
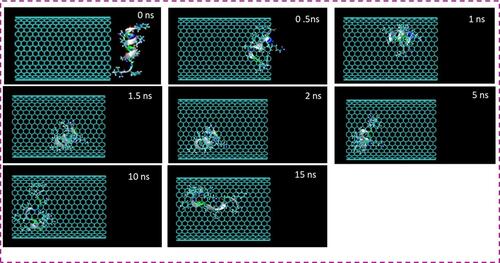
Figure 2 Representative snapshots of insertion of HA-FD-13 into an armchair (20,20) HCNT at various times. For clarity, molecules of water have not been shown.
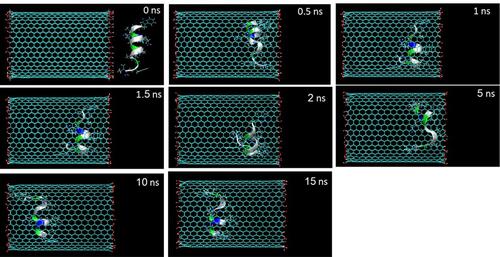
Figure 3 Center of mass (CoM) distance between (A) HA-FD-13 and the CNT; (B) HA-FD-13 and the HCNTs as a function of simulation time; vdW interaction between (C) HA-FD-13 and the CNT (20,20); (D) HA-FD-13 and the HCNT (20,20); (E) coulombic interaction between HA-FD-13 and the HCNT (20,20) as a function of simulation time.
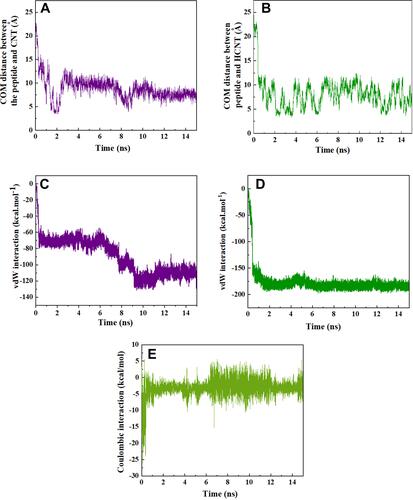
Figure 4 Potential of mean force (PMF) for systems of (A) CNT–peptide and (B) HCNT–peptide complexes computed from ten pullings through the MD simulation. The images represent the positions of HA-FD-13 corresponding to the z-coordinate along the (A) CNT and (B) HCNT at key positions.
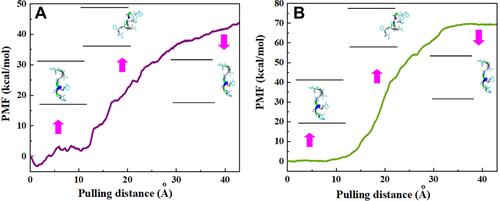
Table 1 Energy contributions (kcal.Mol−1) in the spontaneous encapsulation of HA-FD-13 inside CNTs (20,20). : Free energy variation of the whole system in the encapsulation process.
: Entropy variation of the whole system.
: Enthalpy variation of the whole system.
: Kinetic energy variation of the system in the encapsulation process.
: Multiplication of the volume of the system and pressure change of the whole system,
: Potential energy variation of the system, composed of vdW energy change (
), Elec energy change (
), and bonded-atom energy change (
)
Table 2 Energy contributions (kcal.Mol−1) in the spontaneous encapsulation of HA-FD-13 inside the HCNT (20,20). : Free energy variation of the whole system in the encapsulation process.
: Entropy variation of the whole system.
: Enthalpy variation of the whole system.
: Kinetic energy variation of the system in the encapsulation process.
: Multiplication of the volume of the system and the pressure change of the whole system.
: Potential energy variation of the system, composed of vdW energy change (
), Elec energy change (
), and bonded-atom energy change (
)
Figure 5 (A) Axial views of HA-FD-13 at 0 and 15 ns in the MD simulation. For the sake of clarity, molecules of water have not been shown. (B) Root mean square deviation (RMSD) of HA-FD-13 as a function of simulation time. (C) Radius gyration of HA-FD-13 as a function of simulation time in the CNT– HA-FD-13 complex.
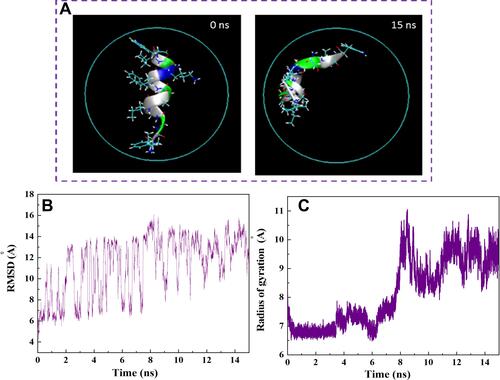
Figure 6 (A) Axial views of HA-FD-13 at 0 and 15 ns in the MD simulation. For the sake of clarity, molecules of water have not been shown. (B) Root mean square deviation (RMSD) of HA-FD-13 as a function of simulation time. (C) Radius gyration of HA-FD-13 as a function of simulation time in the HCNT–peptide complex.
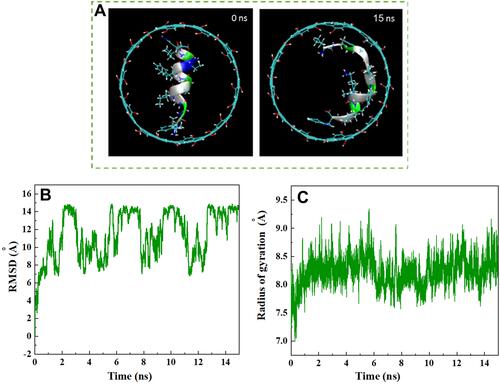
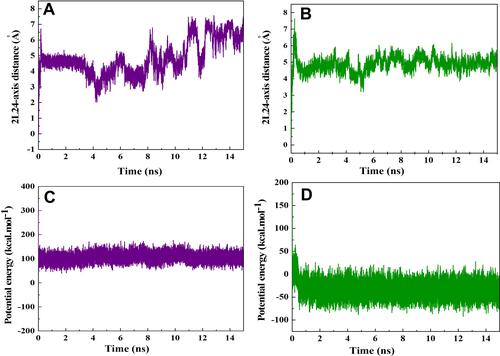
Figure 7 Distance between the center of mass (CoM) of HA-FD-13 and the central axis of (A) the CNT and (B) HCNT as a function of simulation time. Potential energy of HA-FD-13 in the (C) CNT–peptide complex and (D) HCNT–peptide as a function of simulation time.