Figures & data
Figure 1 Schematic illustration of the synthesis of Fe3O4-PEG-Cy7-EMO (A) and the possible mechanism of Fe3O4-PEG-Cy7-EMO enabled FI/MRI dual-modal imaging and targeted therapy in pancreatic tumor xenografted mice based on the EPR effect (B).
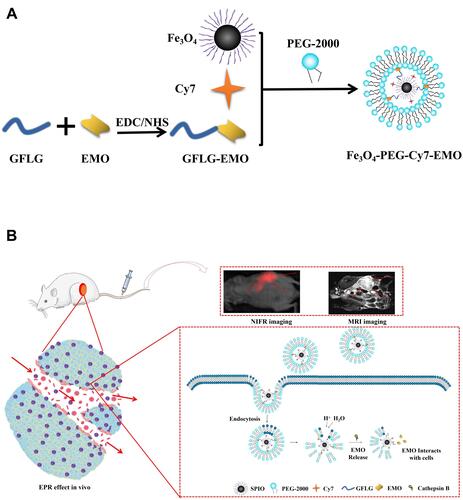
Figure 2 Characterization of NPs.
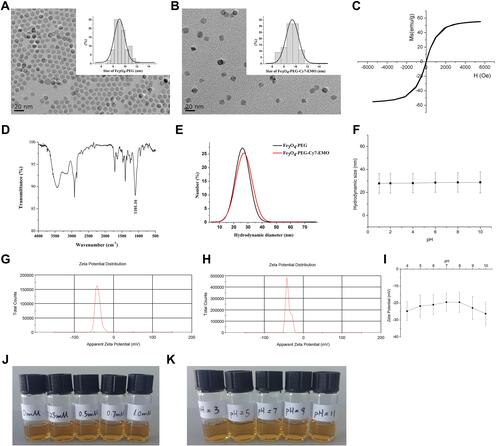
Figure 3 Fe3O4-PEG-Cy7-EMO enabled FI/MRI dual-modal imaging in vitro.
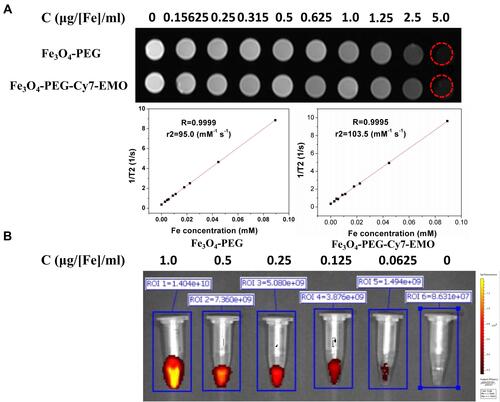
Figure 4 (A) The distribution of Fe3O4-PEG-Cy7-EMO in BxPC-3 and hTERT-HPNE cells examined by bio-TEM under 2 µm and 200 nm scale bars. (B) The distribution of Fe3O4-PEG-Cy7-EMO in BxPC-3 and hTERT-HPNE cells examined by Prussian Blue staining analysis.
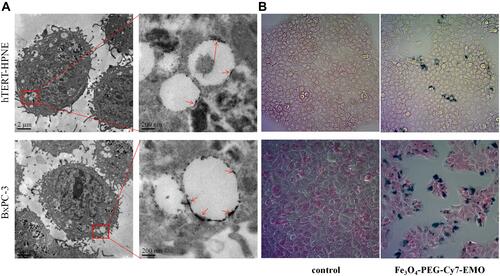
Figure 5 (A) The MTT results of BxPC-3 and hTERT-HPNE cells incubated with Fe3O4-PEG, Fe3O4-PEG-Cy7-EMO, and EMO. (B) Apoptosis assays for BxPC-3 and hTERT-HPNE cells after different treatment. *P < 0.05 for Fe3O4-PEG vs Fe3O4-PEG-Cy7-EMO.
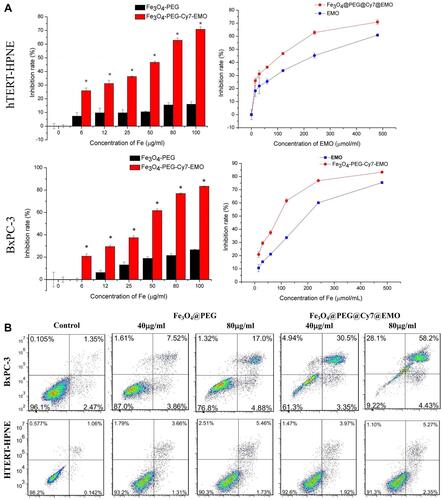
Table 1 The Apoptotic Rates of BxPC-3 and hTERT-HPNE Cells Incubated with Different Concentrations of NPs
Figure 6 (A) The hemolysis experiments in vitro. Different treatments of tubes 1–5 are clarified in (B). (C) In vivo MRI images and (D) time-dependent intensity curves of Fe3O4-PEG and Fe3O4-PEG-Cy7-EMO groups. (E) In vivo fluorescence imaging and (F) ex vivo fluorescence imaging of hearts, livers, spleens, lungs, kidneys, and tumors.
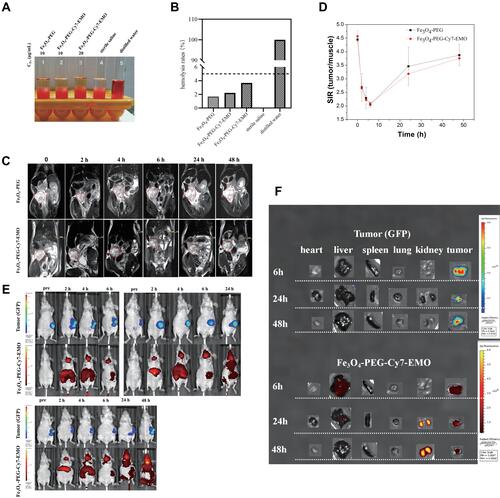
Figure 7 (A) The H&E staining of different organs including hearts, livers, spleens, lungs, and kidneys. No obvious pathological changes were observed. (B) Prussian Blue staining analyses of ex vivo.
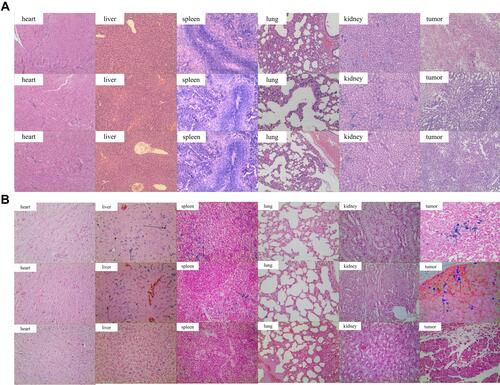
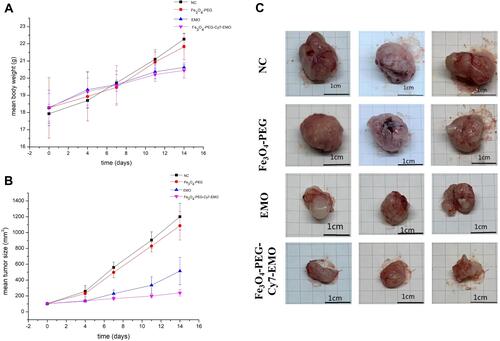
Figure 8 In vivo anti-tumor efficiency.