Figures & data
Figure 1 Effects of HAP nanoparticles on the viability of U251 and SHG44 cells determined by MTT assay.
Abbreviations: HAP, hydroxyapatite; MTT, methyl thiazoletetrazolium; SHG44, human glioma SHG44 cells; U251, human glioma U251 cells.
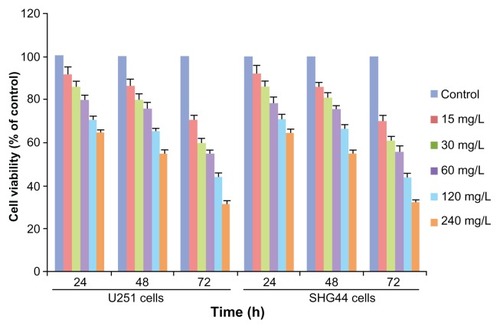
Figure 2 Effect of HAP nanoparticles on the morphologic changes of cells. (A) Hoechst 33342 staining. The apoptotic cells were marked by green fluorescence; scale bar, 20 μm. (B) Transmission electron microscopy.
Notes: Original magnification × 6000; scale bar, 1 μm.
Abbreviations: HAP, hydroxyapatite; SHG44, human glioma SHG44 cells; U251, human glioma U251 cell.
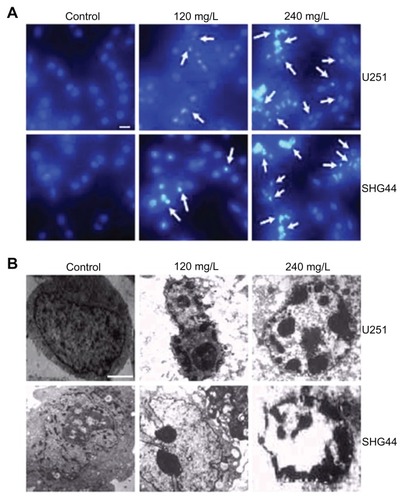
Figure 3 FACS analysis of Annexin-V staining of cells after treatment with 120 and 240 mg/L HAP nanoparticles. (A) Representative FACS scatter plots of cells. (B) Percentages of apoptotic cells in cells after treatment.
Abbreviations: HAP, hydroxyapatite; PI, propidium iodide; SHG44, human glioma SHG44 cells; U251, human glioma U251 cells.
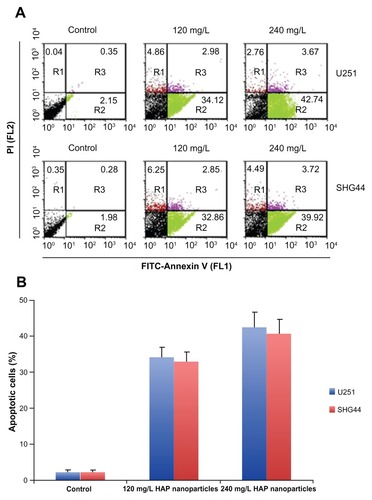
Figure 4 Effect of HAP nanoparticles on the expression of c-Met, SLC22A18 and SATB1 protein in U251 and SHG44 cells in vitro. (A and B) Representative images of western blotting analysis of c-Met, SLC22A18 and SATB1 expression in in U251 and SHG44 cells. (C and D) Level of the c-Met, SLC22A18 and SATB1 protein expression in U251 and SHG44 cells.
Abbreviations: HAP, hydroxyapatite; U251, human glioma U251 cells; SHG44, human glioma SHG44 cells.
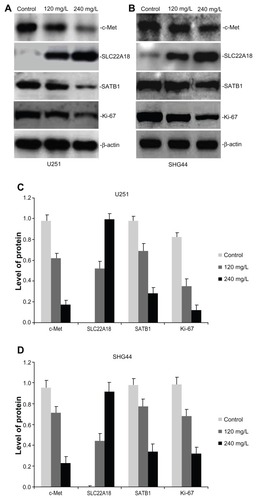
Figure 5 Effects of HAP nanoparticles on weight of tumor-bearing nude mice.
Notes: Lane 1, the control group; lane 2, nano-HAP solution (25 mg/kg) group; lane 3, nano-HAP solution (50 mg/kg) group); lane 4, BCNU (25 mg/kg) group; lane 5, nano-HAP solution (25 mg/mL) and BCNU (25 mg/mL) group.
Abbreviations: Nano-HAPs, hydroxyapatite nanoparticles; BCNU, 1,3-bis(2-chloroethyl)-1-nitrosourea; SHG44, human glioma SHG44 cells; U251, human glioma U251 cells.
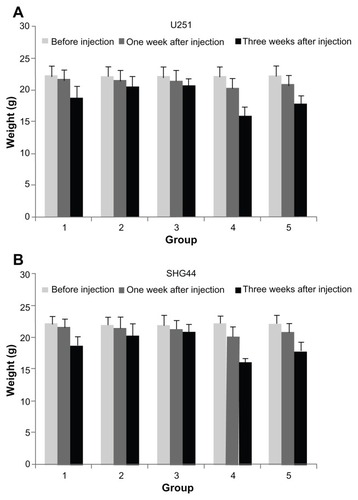
Figure 6 Effect of HAP nanoparticles on tumor growth in vivo. (A and B) Subcutaneous tumor model. (C and D) Tumor growth curves of each group over 28 days.
Abbreviation: Nano-HAPs, hydroxyapatite nanoparticles; BCNU, 1,3-bis(2-chloroethyl)-1-nitrosourea; U251, human glioma U251 cells; SHG44, human glioma SHG44 cells.
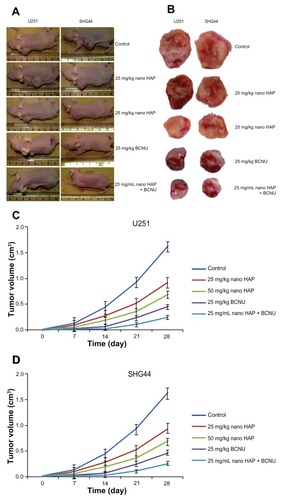
Figure 7 In vivo assessment of apoptosis by TUNEL assay in the glioma tissues of nude mice at one month after treatment. (A) Representative images of TUNEL assay. Original magnification: × 400. (B) Apoptotic index in the glioma U251 and SHG44 cell tissues of nude mice.
Abbreviations: TUNEL, transferase-mediated dUTP nick end labeling; U251, human glioma U251 cells.
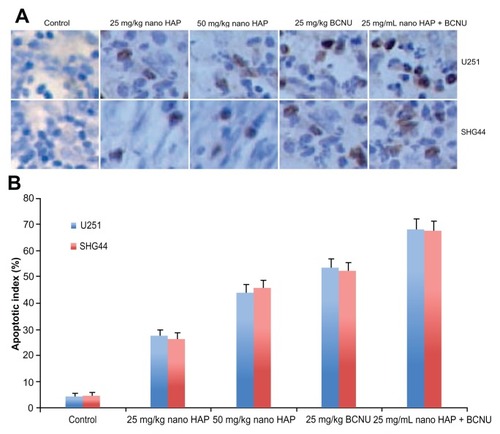
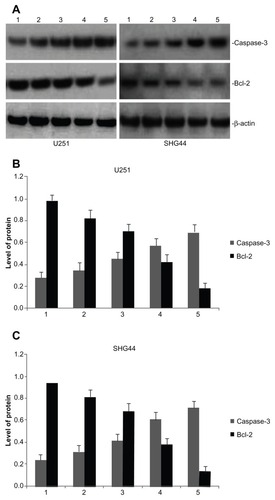
Figure 8 Effect of HAP nanoparticles on the expression of caspase-3 and bcl-2 protein in U251 and SHG44 cells in vivo. (A) Representative images of western blotting analysis of caspase-3 and bcl-2 expression. (B and C) Level of the caspase-3 and bcl-2 protein expression in tumors.
Notes: Lane 1, the control group; lane 2, nano-HAP solution (25 mg/kg) group; lane 3, nano-HAP solution (50 mg/kg) group; lane 4, BCNU (25 mg/kg) group; lane 5, nano-HAP solution (25 mg/mL) and BCNU (25 mg/mL) group.
Abbreviations: Nano-HAP, hydroxyapatite nanoparticles; U251, human glioma U251 cells; SHG44, human glioma SHG44 cells; BCNU, 1,3-bis(2-chloroethyl)-1-nitrosourea.