Figures & data
Figure 1 Characterization of hUC-MSC-sEVs. (A) Schematic diagram of the extraction process of hUC-MSC-sEVs. (B) Under the electron microscope, the hUC-MSC-sEVs show a circular bilayer structure with a diameter of about 100 nm. (C) The results of nFCM showed that the diameter of hUC-MSC-sEVs was about 80.48 nm. (D) Proportional relationship among original supernatant volume, quantification of cells and vesicles particles, and amount of protein extracted from hUC-MSC-sEVs. (E) The surface markers of hUC-MSC-sEVs were identified by nFCM. CD9, CD63, and CD81 were found to be positive in hUC-MSC-sEVs. (F) hUC-MSC-sEVs’ internalization to chondrocytes. hUC-MSC-sEVs (labeled with PKH67 dye, green) and chondrocytes (nuclei were stained with DAPI) were co-incubated for 12 h, respectively. In the control group, PKH67 dye was co-incubated with chondrocytes for 12 h, respectively. Representative fluorescence images are shown above (scale bar = 100 μm; scale bar in magnification = 50 μm).
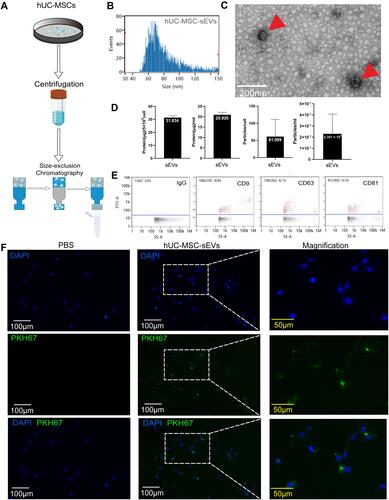
Figure 2 hUC-MSCs and hUC-MSC-sEVs effects on chondrocyte proliferation and migration. (A) Schematic diagram of co-culture using transwell chambers. (B) CCK-8 assay was used to evaluate the proliferation of chondrocytes. Both of two treatments showed greater proliferation potential compared to the control group at 24, 48 and 72h. (C and D) Scratch wound assays demonstrated that hUC-MSC-sEVs dose-dependently enhanced the migration of chondrocytes, whereas the effects of hUC-MSCs treatment were significantly weaker than those of the sEVs3 group. Data are expressed as mean ±SEM. Different number of asterisk (*) show significant differences between groups. (scale bar = 100 μm) (*= P<0.05; **= P<0.01; ***= P<0.005; ****= P<0.001.).
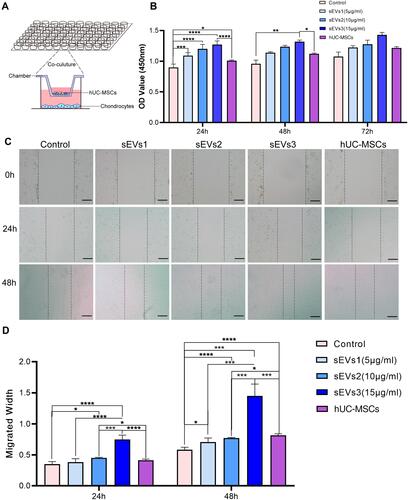
Figure 3 Effect of hUC-MSCs and hUC-MSC-sEVs on the repair of cartilage damage in ACLT-induced OA rats. (A) Gross appearance of the articulation of three groups at week 9 after OA induction. (B) Intraarticular injection therapy. (C and D) H&E and Safranin O/Fast Green staining reveals that the cartilage injuries in the control group were the most serious among all groups, which exhibited fractured cartilage, thickened subchondral bone, abnormal distribution of chondrocytes and loss of proteoglycan. Data are expressed as mean ±SEM. Different number of asterisk (*) show significant differences between groups. (scale bar = 100 μm) (****= P<0.001).
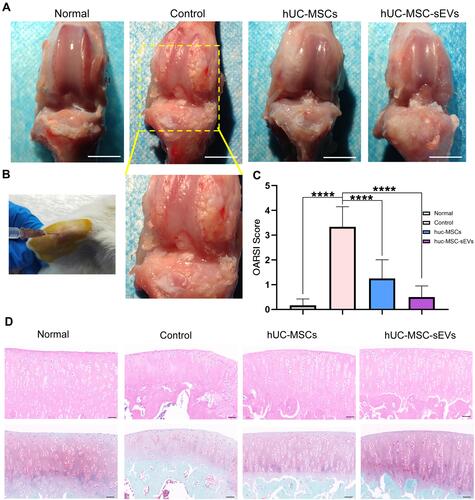
Figure 4 Exploration of the effects of two treatments on cartilage matrix in vivo. (A and B) The immunohistochemical staining was performed to clarify the expression of Collagen II, MMP13 and ADAMTS5 in articulate (The magnification in A is 100×, scale bar = 100 μm; in B is 400×, scale bar = 20 μm;). (C) Statistical analysis of the percentage of pixels in the image or selection in three groups. Data are expressed as mean ±SEM. Different number of asterisk (*) show significant differences between groups. (*= P<0.05; ****= P<0.001.).
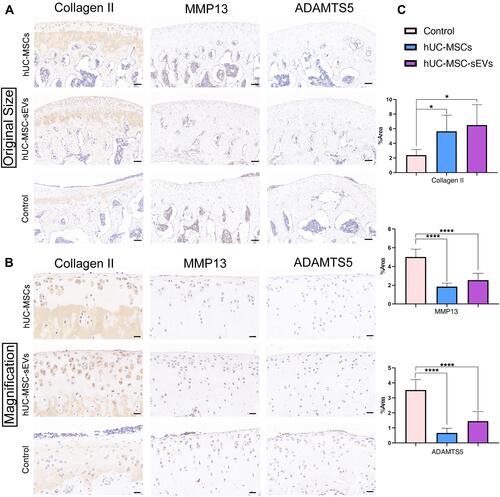
Figure 5 (A and B) Immunohistochemical staining of the extent of macrophage infiltration in the synovial tissues (The magnification in A is 100x, scale bar = 100 μm; in B is 400×, scale bar = 20 μm;). (C) Quantitative analyses of IHC index of synovial membrane. Data are expressed as mean ±SEM. Different number of asterisk (*) show significant differences between groups. (***= P<0.005; ****= P<0.001).
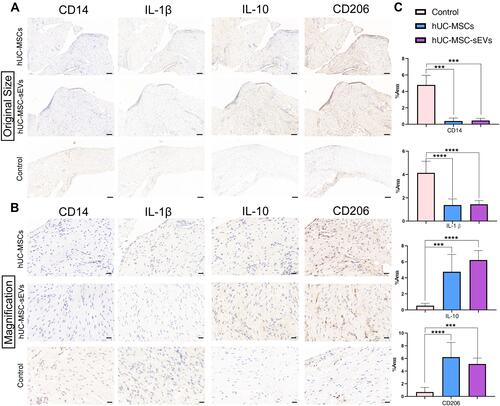
Figure 6 The LC-MS/MS was used for proteomic analysis of hUC-MSCs and hUC-MSC-sEVs in biological triplicates. (A) A total of 457,585 spectrum, 50,947 peptides, and 6279 proteins were detected. (B) In the protein expression profiles of hUC-MSCs and hUC-MSC-sEVs, we detected 6204 and 4478 proteins respectively. (C) The majority of these chondrogenesis‐related proteins were highly enriched in hUC-MSC-sEV. Data are expressed as mean ±SEM. Different number of asterisk (*) show significant differences between groups. (**= P<0.01; ***= P<0.005; ****= P<0.001).
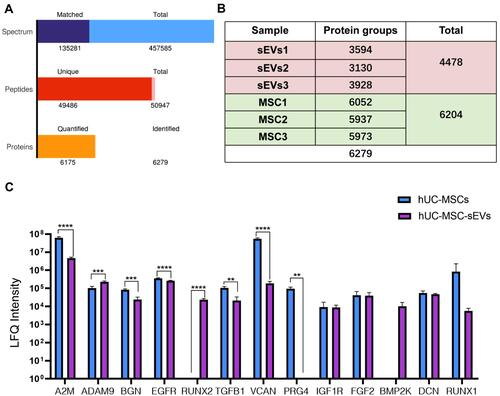
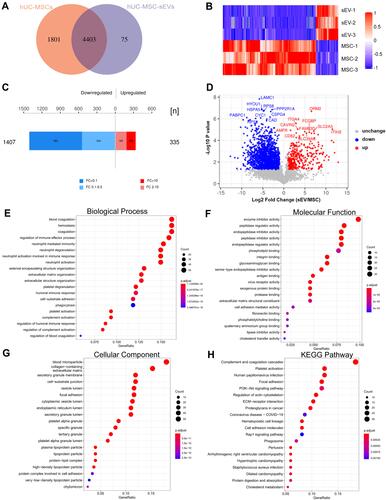
Figure 7 Biological mechanisms of hUC-MSCs and hUC-MSC-sEVs in cartilage repair. (A) Venn diagram analyzes the within-group protein identification overlap. (B) Differentially expression proteins. (C and D) The volcano plot and histogram identified 335 upregulated and 1407 downregulated proteins in hUC-MSC-sEVs group compared with their parent cell hUC-MSCs. (E) Analyses of biological process (BP). (F) Molecular function (MF) category. (G) Analyses of cellular component(CC). (H) KEGG pathway analyses.