Figures & data
Figure 1 Structure of curcumin.
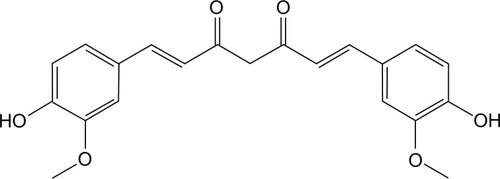
Table 1 Characteristics of nanoparticles (NPs)
Figure 2 Synthesis of poly (ε-Caprolactone)-poly (ethylene glycol)-poly (ε-Caprolactone).
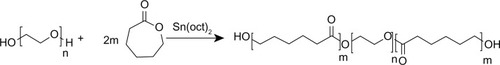
Figure 3 Fourier transform infrared spectra of poly (ethylene glycol) (A), ε-Caprolactone (B) and poly (ε-Caprolactone)-poly (ethylene glycol)-poly (ε-Caprolactone) (C).
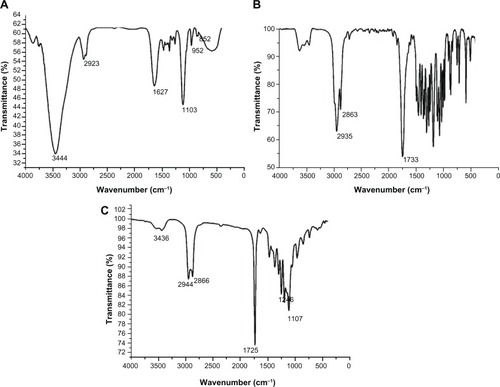
Figure 4 Proton nuclear magnetic resonance spectrum of poly (ε-Caprolactone)-poly (ethylene glycol)-poly (ε-Caprolactone).
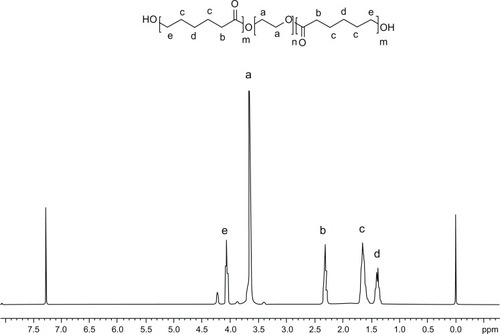
Figure 5 Gel permeation chromatogram of poly (ε-Caprolactone)-poly (ethylene glycol)-poly (ε-Caprolactone).
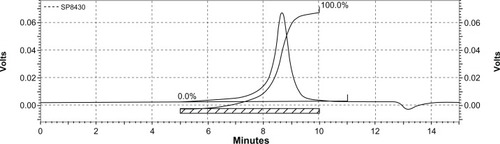
Figure 6 Particle size distribution of NP43 (blank (A) and curcumin-loaded (B)) and NP63 (blank (C) and curcumin-loaded (D)).
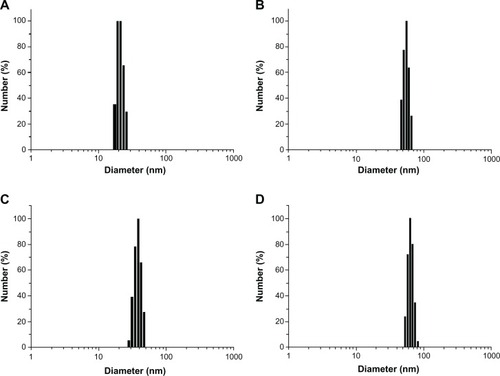
Figure 7 Transmission electron microscopy image of curcumin-loaded NP63.
Notes: 72,000 × magnification; scale bar is 100 nm.
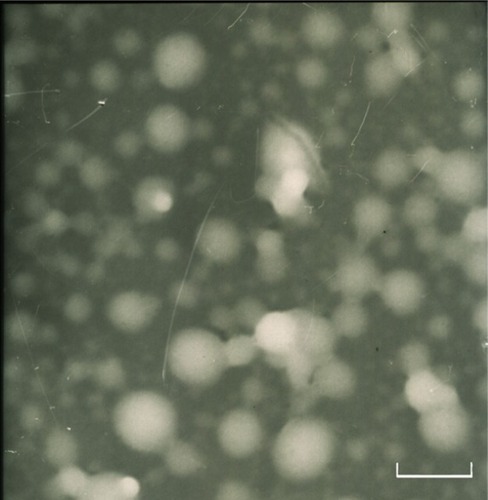
Figure 8 Fourier transform infrared spectra of native curcumin (A), poly (ε-Caprolactone)-poly (ethylene glycol)-poly (ε-Caprolactone) (B), void NP63 (C), and curcumin-loaded NP63 (D).
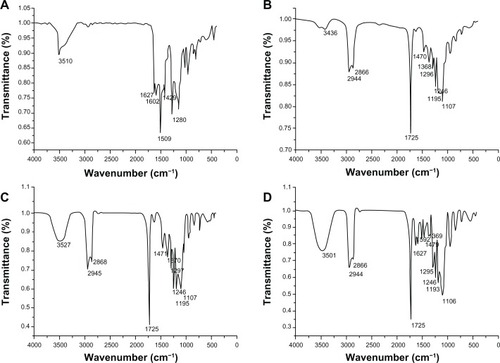
Figure 9 Differential scanning calorimetry thermograms of native curcumin (A), void NP63 (B), and curcumin-loaded NP63 (C).
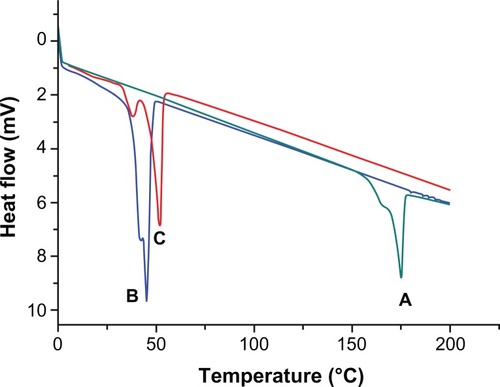
Figure 10 In vitro curcumin (CUR)-release profiles from two NPs (NP43 and NP63) at ph 5.0 at 37°C.
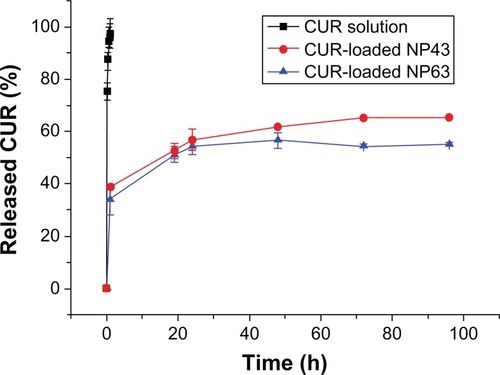
Figure 11 Concentration profile of curcumin (CUR) in plasma versus time after intravenous injection of CUR solution or CUR nanoparticles.
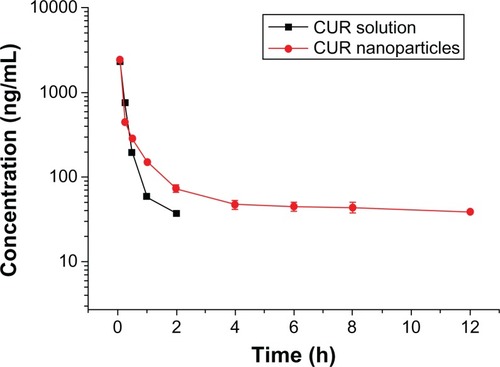
Table 2 The pharmacokinetic parameters of curcumin (CUR) solution and CUR nanoparticles (NPs) (n = 5)