Figures & data
Figure 1 The 1H NMR spectra of cinnamic-acid-modified PEG (A), α-CD (B), and polyrotaxanes (C).
Abbreviations: PEG, poly(ethylene glycol); α-CD, α-cyclodextrin.
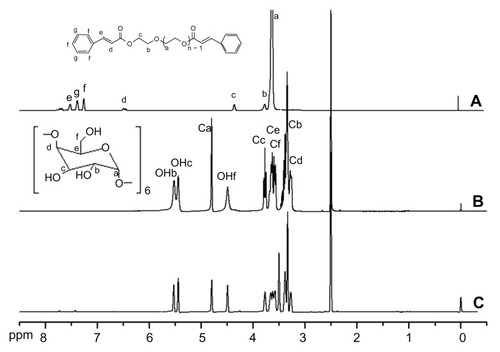
Figure 2 The XRD spectra of α-cyclodextrin (A), cinnamic-acid-modified PEG (B), and polyrotaxane (C).
Abbreviations: XRD, X-ray diffractometry; PEG, poly(ethylene glycol).
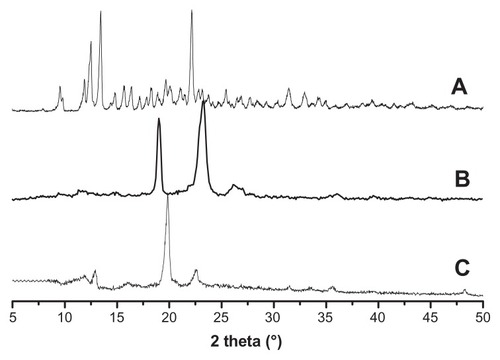
Figure 3 Size distributions and morphologies of blank and drug-loaded polyrotaxane nanoparticles. (A) DLS of blank nanoparticles; (B) DLS of drug-loaded nanoparticles; (C) TEM photograph of blank nanoparticles; (D) AFM image of blank nanoparticles; (E) TEM photograph of drug-loaded nanoparticles; (F) AFM image of drug-loaded nanoparticles.
Abbreviations: DLS, dynamic light scattering; TEM, transmission electron microscopy; AFM, atomic force microscopy.
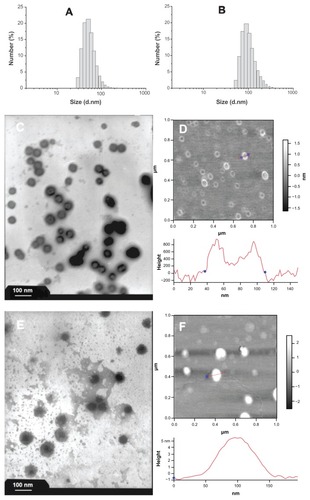
Figure 4 The illustrated formation of drug-loaded polyrotaxane nanoparticles.
Abbreviations: PEG, poly(ethylene glycol); DOX, doxorubicin.
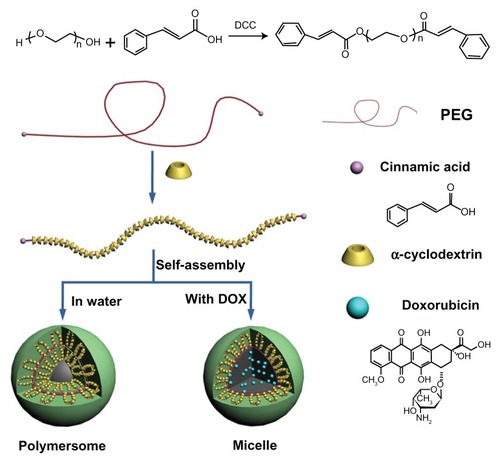
Table 1 The drug-loading content and encapsulation efficiency of polyrotaxane nanoparticles
Figure 5 Release profiles of doxorubicin hydrochloride (A) and drug-loaded polyrotaxane nanoparticles (B).
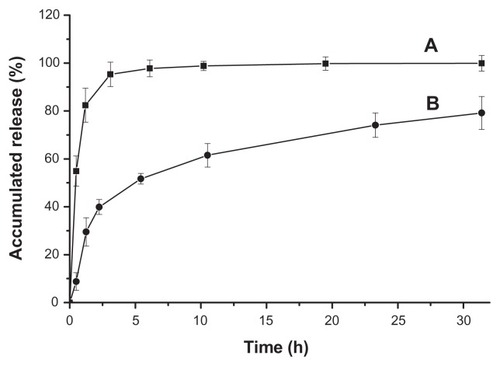
Figure 6 The cytotoxicity of blank polyrotaxane nanoparticles.
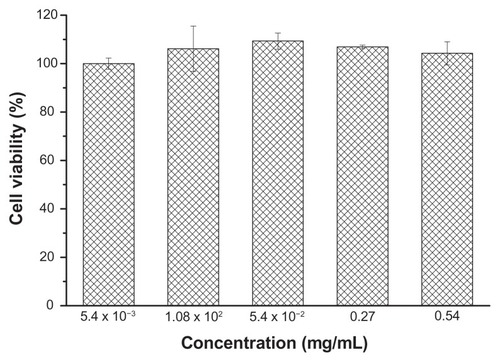
Figure 7 The in vitro inhibition effect of drug-loaded polyrotaxane nanoparticles on 4T1 breast cancer cells.
Note: The concentration of doxorubicin was 10 μg/mL.
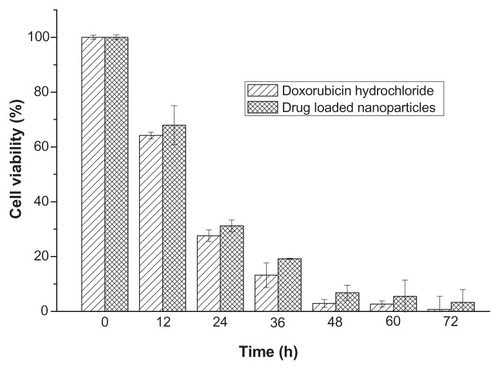
Figure 8 Confocal microscopy photographs of doxorubicin and drug-loaded nanoparticles incubated with 4T1 breast cancer cells. (A) doxorubicin hydrochloride and (B) doxorubicin-loaded nanoparticles incubated for 3 hours; (C) doxorubicin hydrochloride and (D) doxorubicin-loaded nanoparticles incubated for 13 hours.
Note: The photographs from left to right (numbered 1 to 4) are the overlapped photos of bright field and doxorubicin stained nuclei.
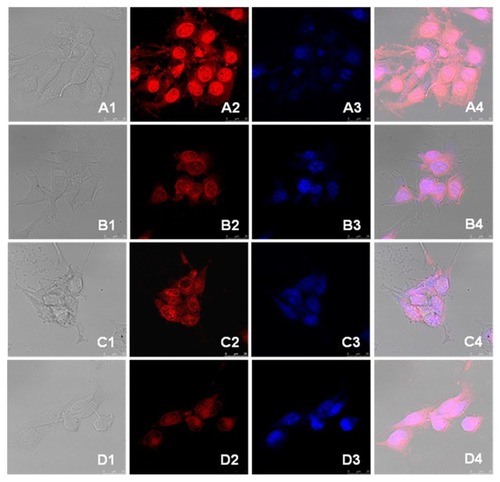
Figure 9 The in vivo inhibition effect of doxorubicin-loaded polyrotaxane nanoparticles on tumor growth in mice via venous injection.
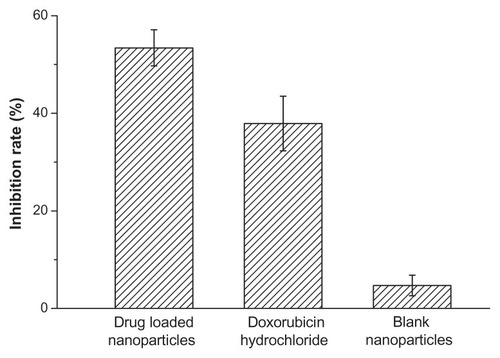
Figure 10 The inhibition rate of drug-loaded nanoparticles to breast cancer in mouse models.
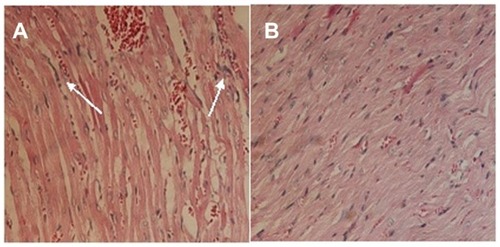
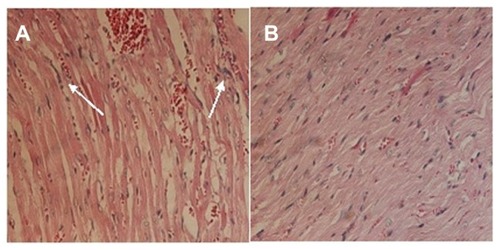
Figure 11 Histological photographs of mice cardiac muscles administrated with doxorubicin hydrochloride (A) and drug-loaded polyrotaxane nanoparticles (B).
Note: The arrows show the inflammation.