Figures & data
Figure 1 Constitutively activated signal transducer and activator of transcription-3 (Stat3) in cancer cell lines: parental A549 and A549-derived paclitaxel-resistant A549/T12. (A) Analysis of baseline tyrosine-activated and total Stat3 protein in A549 and A549/T12 cells. The protein extract from A549 cells after treatment with 10 ng/mL interleukin-6 was used as the positive control for activated Stat3 protein for 30 minutes. β-actin protein was used as the loading control. Cell viability was assessed by 3-(4,5-dimethylthiazol-2-yl)-2,5-diphenyl tetrazolium bromide assay after paclitaxel treatment at various dosages (0.1 nM, 0.5 nM, 2.5 nM, 12.5 nM, 62.5 nM, 312.5 nM, and 1562.5 nM) for 48 hours. Each experiment was repeated three times. (B) Stat3 expression was examined after exposure of A549 and A549/T12 cells to 0.05 μM or 0.1 μM scrambled small interfering ribonucleic acid or Stat3 small interfering ribonucleic acid for 48 hours with or without paclitaxel treatment at various dosages (A549 cells: 0.5 nM, 12.5 nM, and 312.5 nM; A549/T12 cells: 12.5 nM, 62.5 nM, and 312.5 nM). β-actin protein was used as the loading control. Cell viability was assessed by 3-(4,5-dimethylthiazol-2-yl)-2,5-diphenyl tetrazolium bromide assay. Each experiment was repeated three times.
Abbreviations: OD, optical density; siRNA, small interfering ribonucleic acid; Stat3, signal transducer and activator of transcription-3.
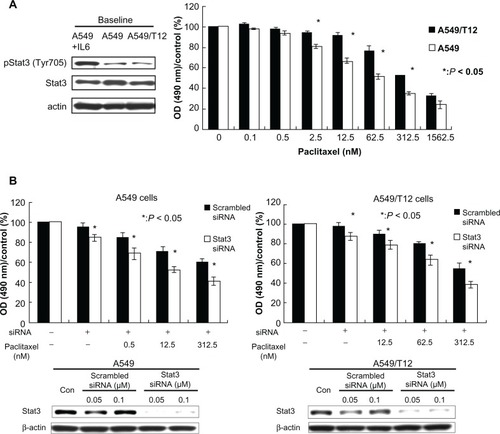
Table 1 Average diameter and zeta potential of poly(lactic-co-glycolic acid) nanoparticles
Figure 2 Characteristics of poly(lactic-co-glycolic acid) (PLGA) nanoparticles. (A) Representative transmission electron micrographs featuring PLGA nanoparticles and PLGA-polyethylenimine (PEI) nanoparticles loaded with signal transducer and activator of transcription-3 (Stat3) and small interfering ribonucleic acid (siRNA); siRNA was carried at the outer layer of the PLGA-PEI nanoparticles loaded with siRNA (marked with arrows). Scale bars represent 100 nm. (B) The release percent of encapsulated Oregon Green paclitaxel from PLGA-PEI nanoparticles loaded with Oregon Green paclitaxel and cyanine-5 siRNA from PLGA-PEI loaded with Oregon Green paclitaxel and cyanine-5-labeled Stat3 siRNA were measured in phosphate buffered saline several times within 24 hours (3, 6, 9, 12, and 24 hours) using a fluorescence spectrophotometer. The experiment was performed three times. (C) The release percent of encapsulated Oregon Green paclitaxel from PLGA-PEI nanoparticles loaded with Oregon Green paclitaxel and PLGA-PEI nanoparticles loaded with Oregon Green paclitaxel and Stat3 siRNA was measured in phosphate buffered saline each day using a fluorescence spectrophotometer. The experiment was performed three times. (D) The release percent of cyanine-5 siRNA from PLGA-PEI nanoparticles loaded with cyanine-5-labeled Stat3 siRNA and PLGA-PEI nanoparticles loaded with Oregon Green paclitaxel and cyanine-5-labeled Stat3 siRNA was measured in phosphate buffered saline each day. The experiment was performed three times.
Abbreviations: h, hours; NPs, nanoparticles; PLGA, poly(lactic-co-glycolic acid); PLGA-PEI-Cy5-S3SI, poly(lactic-co-glycolic acid)-polyethylenimine nanoparticles loaded with cyanine-5-labeled signal transducer and activator of transcription-3 small interfering ribonucleic acid; PLGA-PEI-Ore TAX, poly(lactic-co-glycolic acid)-polyethylenimine nanoparticles loaded with Oregon Green paclitaxel; PLGA-PEI-Ore TAX-S3SI, poly(lactic-co-glycolic acid)-polyethylenimine nanoparticles loaded with Oregon Green paclitaxel and signal transducer and activator of transcription-3 small interfering ribonucleic acid; PLGA-PEI-S3SI, poly(lactic-co-glycolic acid)-polyethylenimine nanoparticles loaded with signal transducer and activator of transcription-3 small interfering ribonucleic acid; PLGA-PEI-siRNA, poly(lactic-co-glycolic acid)-polyethylenimine nanoparticles loaded with small interfering ribonucleic acid; PLGA-PEI-TAX-Cy5-S3SI, poly(lactic-co-glycolic acid)-polyethylenimine nanoparticles loaded with paclitaxel and cyanine-5-labeled signal transducer and activator of transcription-3 small interfering ribonucleic acid.
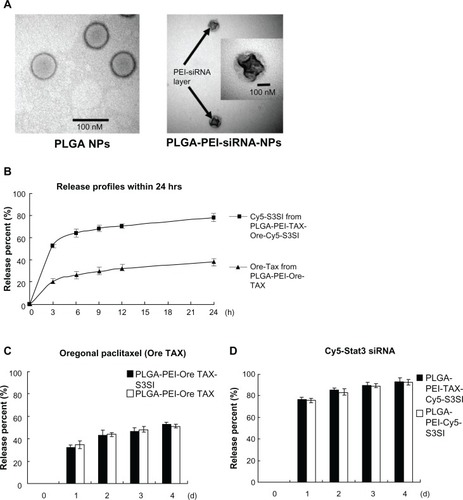
Table 2 Drug delivery efficacy of poly(lactic-co-glycolic acid)-polyethylenimine nanoparticles
Figure 3 Poly(lactic-co-glycolic acid)-polyethylenimine nanoparticles loaded with paclitaxel (PLGA-PEI-TAX) was more cytotoxic to A549 and A549/T12 cells than free paclitaxel alone. (A) Cellular viability was assessed by 3-(4,5-dimethylthiazol-2-yl)-2,5-diphenyl tetrazolium bromide assay when A549 and A549/T12 cells were treated with PLGA nanoparticles and PLGA-PEI nanoparticles for 48 hours. Cells were treated with paclitaxel and PLGA-PEI-TAX at various dosages (0.1 nM, 0.5 nM, 2.5 nM, 12.5 nM, 62.5 nM, and 312.5 nM) in A549 cells and T12 cells for 48 hours. (B) Cellular α-tubulin (red) was blotted by immunostaining and subsequent confocal microscopy 3 hours after A549 cells were treated with 12.5 nM of paclitaxel and 12.5 nM of PLGA-PEI-TAX, respectively. The same experiment was performed with 62.5 nM of paclitaxel and 62.5 nM of PLGA-PEI-TAX in A549/T12 cells.
Notes: The nucleus is shown by 4′,6-diamidino-2-phenylindole staining. Tubulin aggregation is marked with arrows. Scale bar is 5 μm.
Abbreviations: NPs, nanoparticles; OD, optical density; PLGA, poly(lactic-co-glycolic acid); PLGA-PEI-TAX, poly(lactic-co-glycolic acid)-polyethylenimine nanoparticles loaded with paclitaxel.
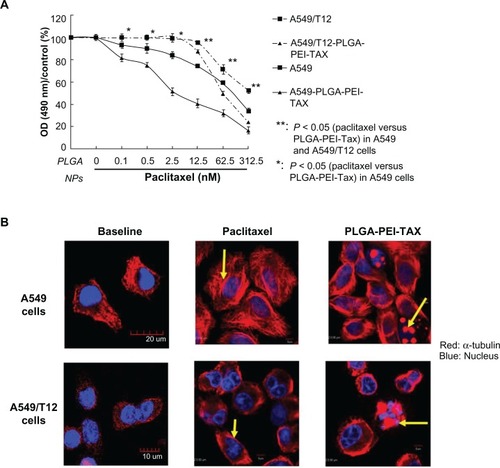
Figure 4 Poly(lactic-co-glycolic acid)-polyethylenimine nanoparticles loaded with signal transducer and activator of transcription-3 (Stat3) small interfering ribonucleic acid (siRNA) effectively suppressed Stat3 protein. (A) Tyrosine-phosphorylated Stat3 and total Stat3 protein were analyzed in A549 and A549/T12 cells 24 hours after treatment with 0.1 μM of poly(lactic-co-glycolic acid)-polyethylenimine nanoparticles loaded with siRNA (either Stat3 siRNA or scrambled siRNA). β-actin protein was used as the loading control. Cellular survival was assessed by 3-(4,5-dimethylthiazol-2-yl)-2,5-diphenyl tetrazolium bromide assay. (B) Cellular Stat1 (red) and Stat3 (green) proteins were demonstrated with immunostaining and subsequent confocal microscopy at baseline and 24 hours after A549 and A549/T12 cells were treated with 0.1 μM of poly(lactic-co-glycolic acid)-polyethylenimine nanoparticles loaded with Stat3 siRNA.
Notes: The nucleus is shown by 4′,6-diamidino-2-phenylindole staining. Scale bar is 10 μm.
Abbreviations: NPs, nanoparticles; OD, optical density; PLGA-PEI-S3SI, poly(lactic-co-glycolic acid)-polyethylenimine nanoparticles loaded with signal transducer and activator of transcription-3 small interfering ribonucleic acid; PLGA-PEI-siRNA, poly(lactic-co-glycolic acid)-polyethylenimine nanoparticles loaded with small interfering ribonucleic acid; siRNA, small interfering ribonucleic acid; Stat1, signal transducer and activator of transcription-1; Stat3, signal transducer and activator of transcription-3.
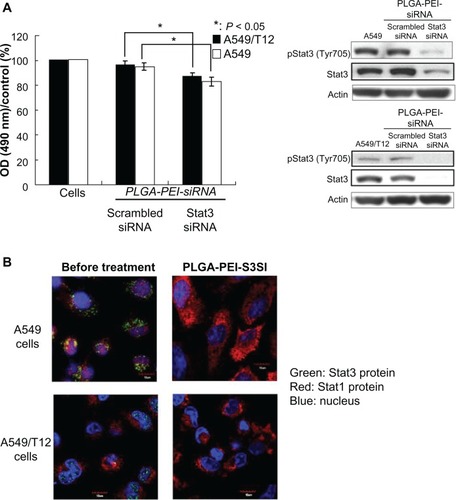
Figure 5 Uptake of poly(lactic-co-glycolic acid)-polyethylenimine nanoparticles loaded with Oregon Green paclitaxel (PLGA-PEI-Ore TAX) was higher in both A549 and A549/T12 cells compared to free Oregon Green paclitaxel. Demonstration of PLGA-PEI nanoparticles simultaneously delivering Oregon Green paclitaxel and cyanine-5-labeled signal transducer and activator of transcription-3 small interfering ribonucleic acid was found in A549 and A549/T12 cells. (A) Confocal microscopy was used to demonstrate intracellular accumulation of 62.5 nM Oregon Green paclitaxel and 62.5 nM PLGA-PEI-Ore TAX (green) 3 hours after treatment in A549 and A549/T12 cells. The left lower square of each panel (magnified cells) shows the different cellular uptake of Oregon Green paclitaxel and PLGA-PEI-Ore TAX in A549 and A549/T12 cells. The nucleus is shown by 4′,6-diamidino-2-phenylindole staining. Scale bar is 10 μm. (B) Intracellular Oregon Green paclitaxel was measured by fluorescence intensity in A549 and A549/T12 cells 3 hours after treatment with 62.5 nM Oregon Green paclitaxel and PLGA-PEI-Ore TAX. (C) Confocal micrograph shows A549 and A549/T12 cells with different interference contrast and different fluorescent-enhanced image 3 hours after treatment with 62.5 nM PLGA-PEI nanoparticles loaded with Oregon Green paclitaxel and cyanine-5-labeled signal transducer and activator of transcription-3 small interfering ribonucleic acid.
Note: Scale bar is either 5 μm or 10 μm.
Abbreviations: Cy5-Stat3 siRNA, cyanine-5-labeled signal transducer and activator of transcription-3 small interfering ribonucleic acid; DAPI, 4′,6-diamidino-2-phenylindole; Ore TAX, Oregon Green paclitaxel; PLGA-PEI-Ore TAX, poly(lactic-co-glycolic acid)-polyethylenimine nanoparticles loaded with Oregon Green paclitaxel.
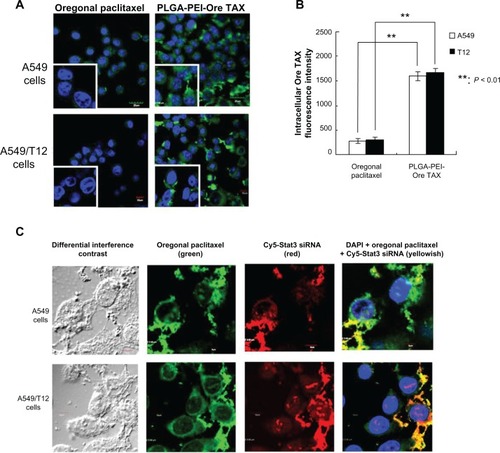
Figure 6 Both A549 and A549/T12 cells were more sensitive to poly(lactic-co-glycolic acid)-polyethylenimine nanoparticles loaded with paclitaxel and signal transducer and activator of transcription-3 (Stat3) small interfering ribonucleic acid (PLGA-PEI-TAX-S3SI). (A) Tyrosine-phosphorylated Stat3 and total Stat3 proteins were blotted 24 hours after A549 and A549/T12 cells were treated with PLGA-PEI-TAX-S3SI. β-actin protein was used as the loading control. Cellular survival was assessed by 3-(4,5-dimethylthiazol-2-yl)-2,5-diphenyl tetrazolium bromide assay after 48 hours of treatment with PLGA-PEI-TAX-S3SI and PLGA-PEI-TAX at various dosages (0.5 nM, 12.5 nM, and 312.5 nM in A549 cells; 12.5 nM, 62.5 nM, and 312.5 nM in A549/T12 cells). (B) Polymerized tubulin was observed 24 hours after A549 cells were treated with 12.5 nM paclitaxel, PLGA-PEI-TAX, and PLGA-PEI-TAX-S3SI, respectively. The same treatment was performed in A549/T12 cells with a higher concentration (62.5 nM). Glyceraldehyde 3-phosphate dehydrogenase protein was used as the loading control. The band density ratio (α-tubulin to glyceraldehyde 3-phosphate dehydrogenase) represents data from three experiments (mean ± standard deviation). (C) Flow cytometric analysis of A549 cells treated with 12.5 nM paclitaxel, PLGA-PEI-TAX, and PLGA-PEI-TAX-S3SI for 24 hours, respectively. The same experiment with higher concentration (62.5 nM) was performed in A549/T12 cells.
Notes: The scatter plot of FL1-H (X-scale) versus FL2-H (Y-scale) indicates Annexin V staining and propidium iodine staining. The experiment was repeated three times, and data are shown as mean ± standard deviation.
Abbreviations: GAPDH, glyceraldehyde 3-phosphate dehydrogenase; OD, optical density; PI, propidium iodine; PLGA-PEI-TAX, poly(lactic-co-glycolic acid)-polyethylenimine nanoparticles loaded with paclitaxel; PLGA-PEI-TAX-S3SI, poly(lactic-co-glycolic acid)-polyethylenimine nanoparticles loaded with paclitaxel and signal transducer and activator of transcription-3 small interfering ribonucleic acid; Stat3, signal transducer and activator of transcription-3.
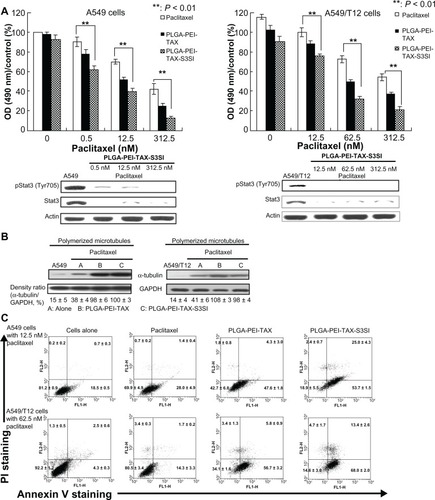
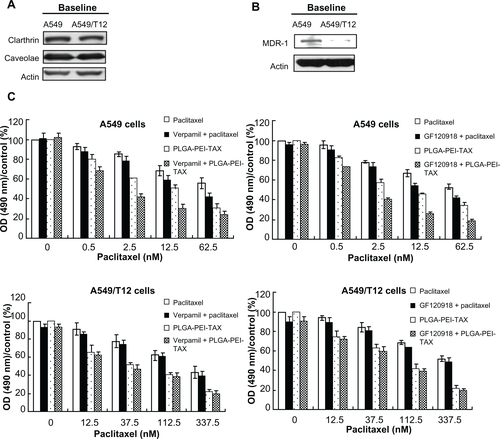
Figure S1 Multidrug resistance-1 (MDR-1), clathrin, and caveolae protein expression in A549 and A549/T12cells and pretreatment with MDR-1inhibitors influenced the cellular survival of A549 and A549/T12cells treated with paclitaxel and poly(lactic-co-glycolic acid)-polyethylenimine nanoparticles loaded with paclitaxel. (A) Analysis of baseline clathrin and caveolae protein expression in A549 and A549/T12 cells. β-actin protein was used as the loading control. (B) Analysis of baseline MDR-1 protein expression in A549 and A549/T12cells. (C) Cellular survival of A549 and A549/T12cells was assessed by 3-(4,5-dimethylthiazol-2-yl)-2,5-diphenyl tetrazolium bromide assay after 48hours of treatment with paclitaxel and poly(lactic-co-glycolic acid)-polyethylenimine nanoparticles loaded with paclitaxel, with and without pretreatment of MDR-1inhibitors (verapamil and GF120918).
Abbreviations: MDR-1, multidrug resistance-1; OD, optical density; PLGA-PEI-TAX, poly(lactic-co-glycolic acid)-polyethylenimine nanoparticles loaded with paclitaxel.