Figures & data
Scheme 1 Schematic illustration of the construction of PLDD NPs and the application for tumor imaging and targeted drug delivery.
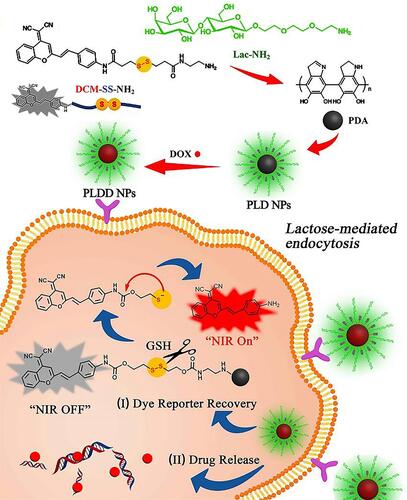
Figure 1 (A) TEM image of PDA NPs; (B) SEM image of PLDD NPs; (C) the size distribution of PLDD NPs by DLS; and (D) Zeta potential of PDA, PDA-Lac, PLD and PLDD NPs, respectively.
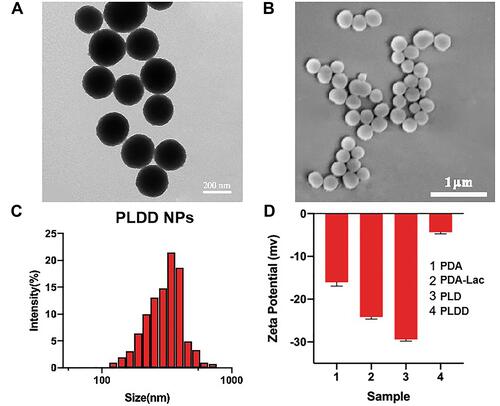
Figure 2 (A) The absorption spectra of DCM-SS-NH2 and DCM-SS-NH2 incubated with GSH (5 mM, 2 h); Emission spectra of DCM from DCM-SS-NH2 (B) and PLD NPs (C) incubated with GSH in DMSO/PBS solution (v/v, 1/1, DCM 20 μM) at 37°C during 2 h, λex= 490 nm, λem= 650 nm; (D) The cumulative drug release (%) of PLDD NPs during 72 h in phosphate buffer solution (pH 5.0, 7.4), respectively.
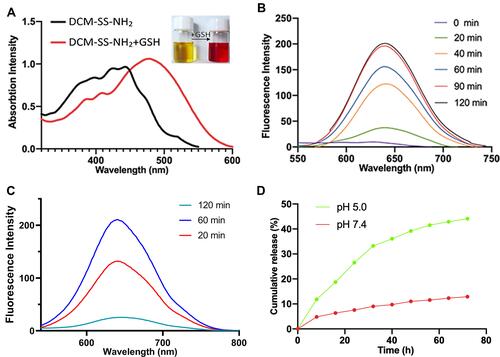
Figure 3 (A) CLSM images of HL7702 cells, HepG2 cells pre-treated with LBA and HepG2 cells cultured with PLD NPs (1 mg·mL-1) for 4 h, respectively. The scale bar is 20 μm; (B) The average fluorescence intensity of different groups of cells; The cell uptake in HL7702 cells (C) and HepG2 cells (D) under different conditions measured by flow cytometry.
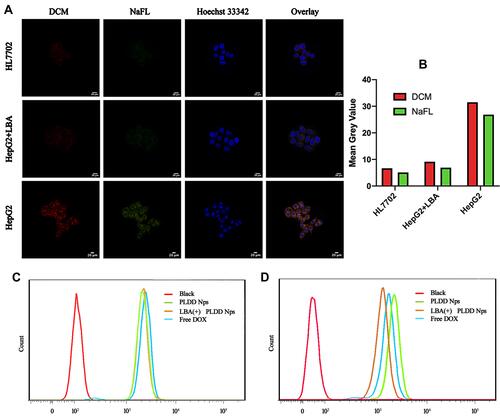
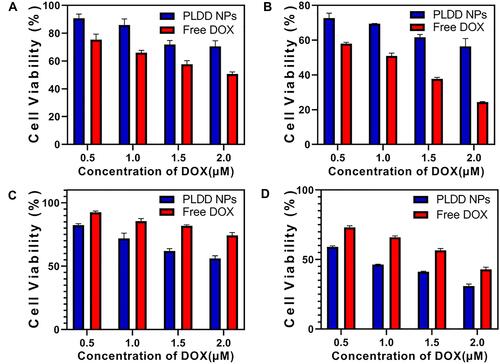
Figure 4 (A-B) HL7702 cells incubated with different concentrations of PLDD NPs and free DOX for 24 h, 48 h, respectively. (C-D) HepG2 cells incubated with different concentrations of PLDD NPs and free DOX for 24, 48 h, respectively.