Figures & data
Scheme 1 The synthesis of S@PLGA and S@C-PLGA NPs.
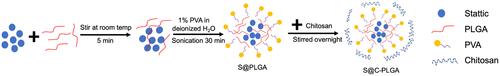
Table 1 Characterization of Nanoparticles in Deionized Water
Figure 1 Evaluation of nanoparticles in term of size. Transmission electron micrographs of blank PLGA NPs (A), S@PLGA NPs (B) and S@C-PLGA NPs (C). Insets show a single particle denoted by arrow. (D) The normalized size distributions of nanoparticles obtained from the analysis of TEM images (n=100) that were quantified using ImageJ software version 2.0.
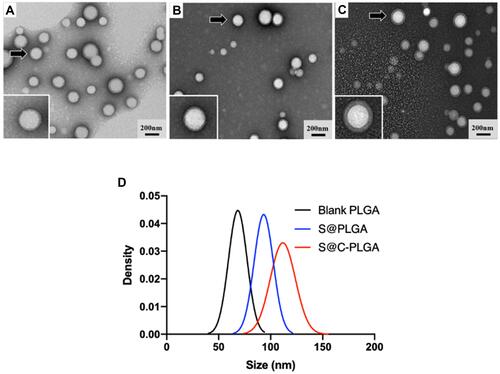
Figure 2 Stattic released in PBS and plasma. Cumulative percentage of Stattic released from S@PLGA NPs and S@C-PLGA NPs in different solution at 0–48 h (A) and 0–2 h (B). Data represent mean ± SEM from three independent experiments; ****Indicate p < 0.0001, as assessed by two-way ANOVA with Tukey’s post-hoc test.
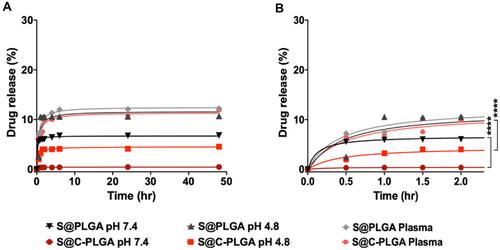
Figure 3 In vitro anti-migration properties of Stattic, S@PLGA and S@C-PLGA NPs in Scratch Assay. Microscopic images of the Scratch Assay on MDA-MB-231 (A) and 4T1 (B) at different time points. (C) The normalized migration rate of MDA-MB-231 and 4T1 cells after being treated with Stattic, S@PLGA and S@C-PLGA NPs at 1 µM Stattic equivalent concentration for 24 h. Data represent mean ± SEM from three independent experiments; ** and ****Indicate p < 0.01, 0.0001, respectively, as assessed by two-way ANOVA with Tukey’s post-hoc test.
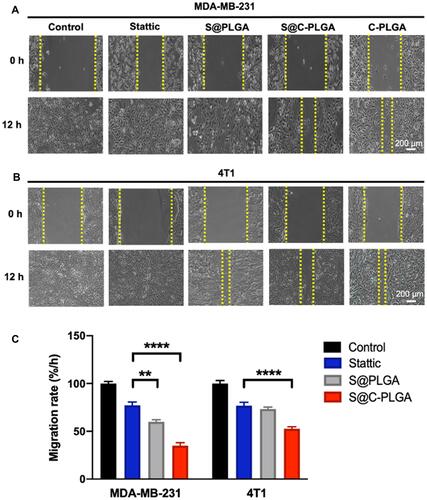
Figure 4 In vitro anti-migration properties of Stattic, S@PLGA and S@C-PLGA NPs in transwell assay. Microscopic images of the transwell migration assay in MDA-MB-231 and 4T1 after treated with 1 μM of Stattic, S@PLGA NPs and S@C-PLGA NPs. The percentage of migrated cells relative to control were quantified using ImageJ software version 2.0. Data represent mean ± SEM from three independent experiments; ** and ****Indicate p < 0.01, 0.0001, respectively, as assessed by two-way ANOVA with Tukey’s post-hoc test.
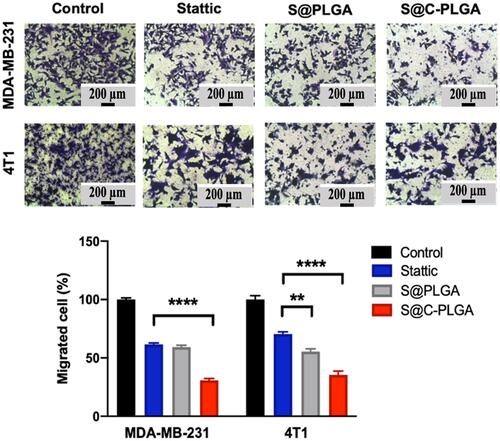
Figure 5 (A) In vivo toxicity profiling and antitumor efficacy study of Stattic and S@C-PLGA NPs. In vivo toxicity profile of Stattic and S@C-PLGA NPs in 4T1 tumor-bearing mice. Data represents the mean body weights ± SEM (n = 3) for each group. (B) In vivo antitumor efficacy of Stattic and S@C-PLGA NPs in 4T1 tumor-bearing mice. S@C-PLGA NPs (24 mg Stattic eqv./kg) showed greater suppression in 4T1 tumor growth compared to Stattic (24 mg/kg) and saline. The day of treatment was indicated as black arrows. Data represents the mean tumor volume ± SEM (n = 4) for each group; ** and **** indicate p < 0.01, 0.0001, respectively, as assessed by one-way ANOVA with Dunnett’s post-hoc test.
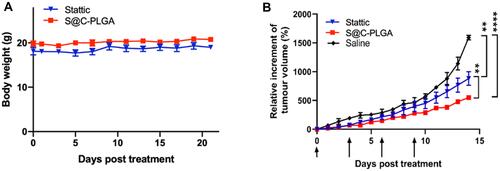
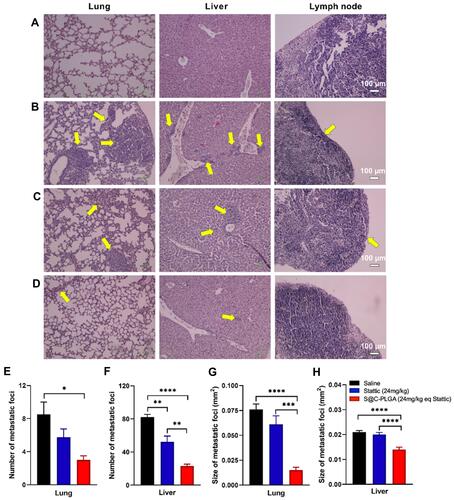
Figure 6 In vivo antimetastatic effects of S@C-PLGA NPs. Histopathological analysis and quantification of metastatic foci for lung, liver, and lymph node of untreated control mice (A) and 4T1 tumor-bearing mice treated with multiple doses of saline (B), Stattic (24 mg/kg) (C) and S@C-PLGA NPs (24 mg Stattic eqv./kg) (D). No metastatic foci were observed in heart, kidney and spleen. Quantification of number of metastatic foci found in lung (E) and liver (F) by observing 5 and 8 images in lung and liver, respectively, for each mouse in all the treatment groups. Average sizes of metastatic foci found in lung (G) and liver (H) for each treatment group. Data represent the mean number of metastatic foci ± SEM (n=4); *, **, *** and ****Indicate p <0.05, 0.01, 0.001 and 0.0001, respectively as assessed by One-way ANOVA with Dunnett’s post-hoc test. Yellow arrows indicate metastatic foci.