Figures & data
Figure 1 Synthetic scheme describing preparation of cyanine near-infrared fluorescent dye.
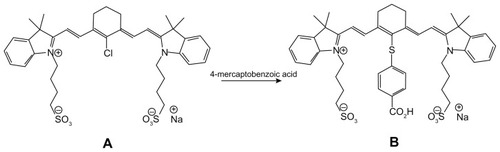
Figure 2 (A) Transmission electron photomicrograph of the near-infrared fluorescent iron oxide-human serum albumin nanoparticles. (B) Histograms demonstrating the diameter and size distribution of the noncoated (dots) and coated (solid line) near-infrared fluorescent iron oxide nanoparticles dispersed in water.
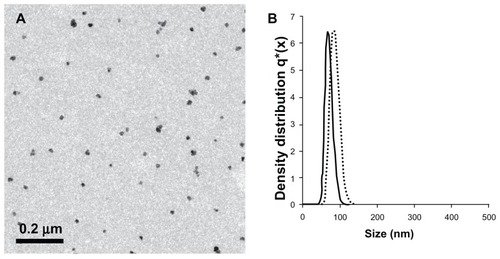
Figure 3 Normalized absorbance and emission spectra of free cyanine near-infrared fluorescent dye (dotted lines) and near-infrared fluorescent iron oxide-human serum albumin nanoparticles (solid lines).
Notes: Maximum absorption of free cyanine near-infrared fluorescent dye and near-infrared fluorescent iron oxide-human serum albumin nanoparticles occur at approximately 790 nm and 810 nm, respectively. Maximum fluorescence emission intensity of cyanine near-infrared fluorescent dye and near-infrared fluorescent iron oxide-human serum albumin nanoparticles occurs at the same wavelength of approximately 818 nm.
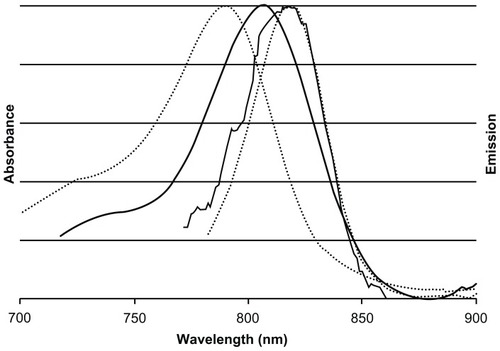
Figure 4 Comparison of fluorescence intensities of equal concentrations of three types of near-infrared fluorescent iron oxide-human serum albumin nanoparticles composed of: iron oxide containing dyed gelatin in the core and a non-dyed human serum albumin shell; iron oxide containing non-dyed gelatin in the core and a dyed human serum albumin shell; iron oxide containing dyed gelatin in the core as well as in a dyed human serum albumin shell.
Notes: The highest fluorescence intensity was shown by particles containing dye within both the core and the shell (type 3). The inset shows a fluorescence image of equal concentrations of each type of particle dispersed in phosphate-buffered saline solution.
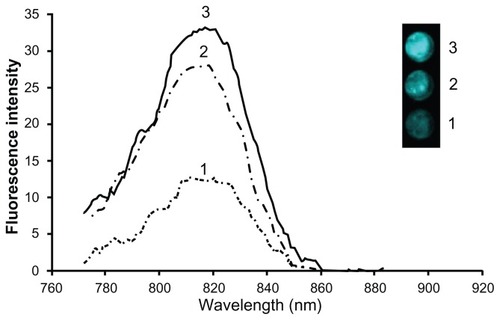
Figure 5 Photostability of the near-infrared fluorescent iron oxide-human serum albumin nanoparticles (black line) and free cyanine near-infrared fluorescent dye (gray line) as a function of time.
Note: Samples of cyanine near-infrared fluorescent dye containing iron oxide-human serum albumin nanoparticles and free cyanine near-infrared fluorescent dye were illuminated with a Xenon flash lamp for 20 minutes as described in the experimental section.
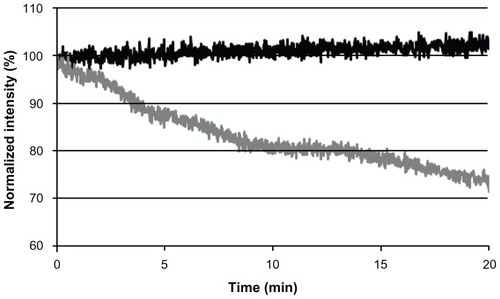
Figure 6 Light photograph of a LS174T tumor delimited by a plastic ring on chicken chorioallantoic membrane in situ in the egg.
Note: Suspensions of 5 × 10⁶ LS174T cells in Matrigel® formed compact structures (asterisks) 7 days after transplantation that apparently attracted host blood vessels (arrows).
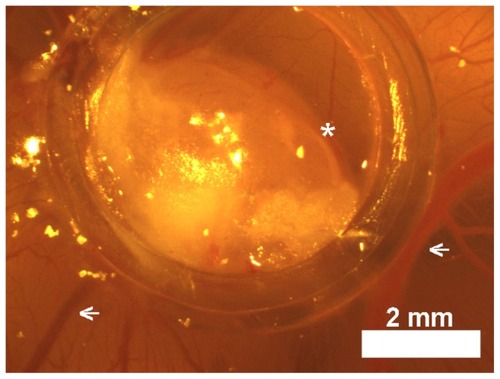
Figure 7 Fluorescence imaging of tumors on chicken embryo chorioallantoic membrane. (A) Merged fluorescent and bright light images of a typical experiment involving a LS174T tumor cell line implanted in chicken embryo chorioallantoic membrane treated with peanut agglutinin-conjugated (I), anticarcinoembryonic antigen antibody-conjugated (II), and glycine (III)-conjugated iron oxide-human serum albumin near-infrared fluorescent nanoparticles. (B) Quantification of the fluorescence intensity of the tumors averaged over the surface area as calculated by ImageJ software.
Notes: Vertical axis is logarithmically scaled. This experiment was repeated three more times with similar results.
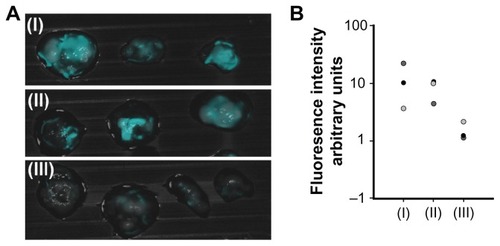
Figure 8 Fluorescence imaging of tumors on chicken embryo chorioallantoic membrane. (A) Merged fluorescent and bright light images of a typical experiment involving peanut agglutinin-conjugated or anticarcinoembryonic antigen antibody-conjugated iron oxide-human serum albumin NIR fluorescent nanoparticles topically administered to LS174T (I and III, respectively) and SW480 (II and IV, respectively) tumor cell lines implanted on chicken embryo chorioallantoic membrane. (B) Quantification of fluorescence intensity of tumors averaged over the surface area, as calculated by ImageJ software.
Notes: Vertical axis is logarithmically scaled. This experiment was repeated three more times with similar results.
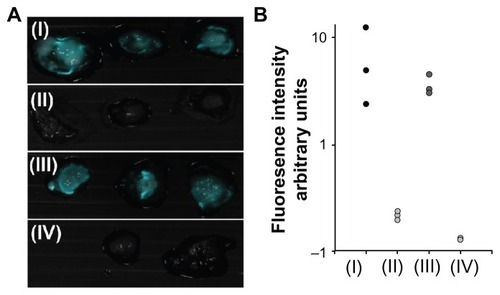
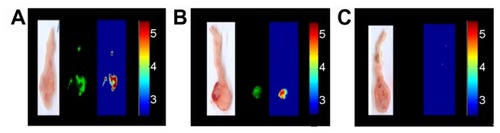
Figure 9 Typical experiment showing a mouse colon treated with (A) peanut agglutinin-conjugated and (B) anticarcinoembryonic antigen antibody-conjugated iron oxide-human serum albumin near-infrared fluorescent nanoparticles. Each set of experiments includes a color photograph, a fluorescent image, and a logarithmically scaled fluorescent image. (C) Untreated tumor indicating a negligible level of tumor autofluorescence. (B and C) Bioactive, conjugated fluorescent iron oxide-human serum albumin nanoparticles selectively label the LS174T tumors and leave the surrounding nonpathological tissue relatively unlabeled, with a signal-to-background ratio of 1 : 1 × eCitation25.
Note: This experiment was repeated three more times with similar results.