Figures & data
Figure 1 FL L-cystine dissociation to form monomer in presence of dithiothreitol.
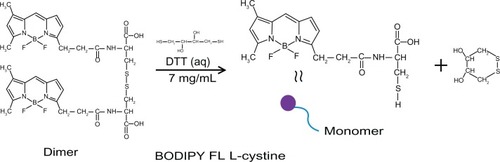
Figure 2 Schematic representation for synthesis of gold nanoparticles conjugated with BODIPY® and with BODIPY-PEG.
Abbreviations: PEG, poly(ethylene glycol); AuNPs, gold nanoparticles.
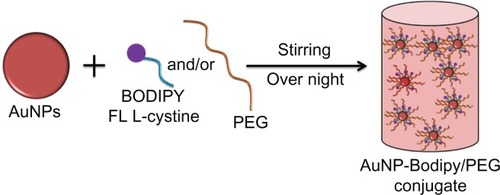
Figure 3 (A) Absorbance spectra of BODIPY® with Lambda Max values at 479.3 nm and 503.5 nm. (B) Photoluminescence spectra of BODIPY with emission at 513 nm (340 nm excitation).
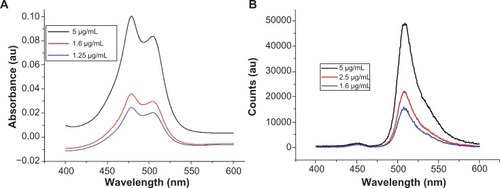
Table 1 Ultraviolet-visible characteristics of AuNPs samples modified with BODIPY and or PEG with corresponding Lambda Max and absorbance values
Figure 4 Ultraviolet-visible spectra of (A) gold nanoparticles conjugated with BODIPY® and (B) gold nanoparticles conjugated with BODIPY-PEG.
Abbreviations: PEG, poly(ethylene glycol); AuNPs, gold nanoparticles.
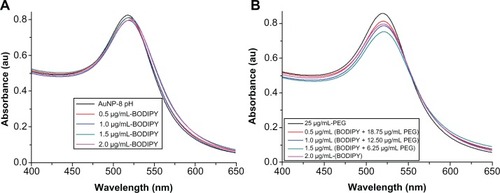
Figure 5 Dynamic light scattering and zeta potential of gold nanoparticles coated with (A) BODIPY® and (B) BODIPY-PEG.
Abbreviations: DLS, dynamic light scattering; PEG, poly(ethylene glycol); AuNPs, gold nanoparticles.
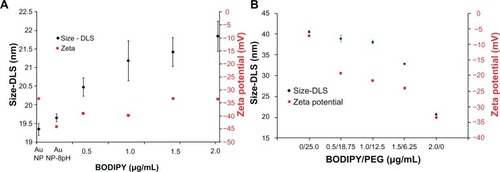
Figure 6 Transmission electron microscopic images for gold nanoparticles (A). Gold nanoparticles conjugated with BODIPY® (2.0 μg/mL), (B). Gold nanoparticles conjugated with BODIPY-PEG (1.5–6.25 μg/mL), (C). And gold nanoparticles conjugated with PEG (25.0 μg/mL) (D).
Note: Scale is 20 nm at 145,000×.
Abbreviation: PEG, poly(ethylene glycol).
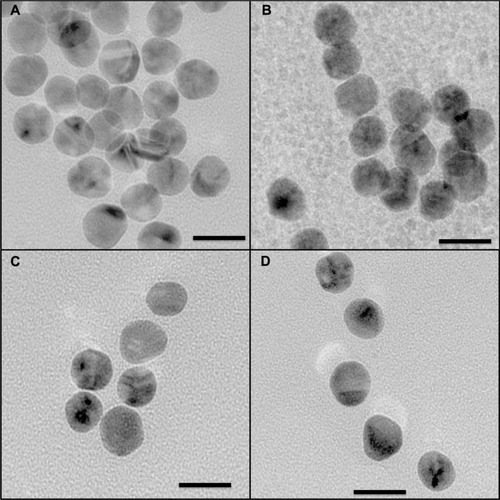
Figure 7 Fourier transform infrared spectra for samples of gold nanoparticles conjugated with BODIPY®-PEG with left and right inset spectra of pure PEG and BODIPY, respectively.
Abbreviation: PEG, poly(ethylene glycol).
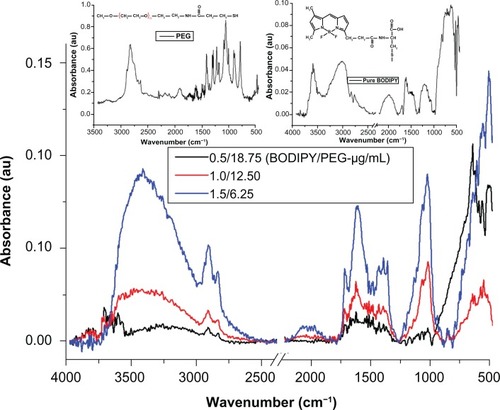
Figure 8 UV-Visible spectra of gold nanoparticles capped with 0.5 μg/ml of BODIPY (A) and 0.5–18.75 μg/ml of BODIPY-PEG (B) in 5 mM glutathione (GSH) solution. The inset images showing the color of as prepared (AP) nanoparticles and after 60 minutes and at day 5 in 5 mM GSH.
Abbreviation: PEG, poly(ethylene glycol).
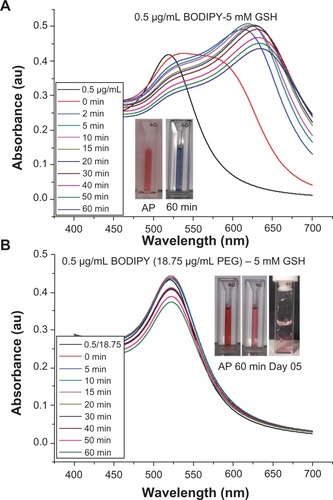
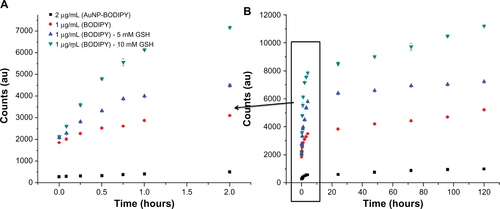
Figure 9 Gold Au nanoparticles conjugated with BODIPY®-PEG and with BODIPY (1.0 μg/mL) released in 5 mM and 10mM glutathione (GSH). First 2 hours of release (A) and release until day 5 (B) expressed as photoluminescence (PL) counts.
Abbreviation: PEG, poly(ethylene glycol).
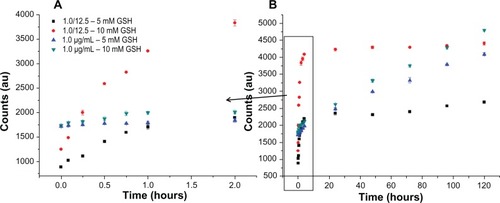
Figure 10 Release of BODIPY® over 2 hours (A) and 5 days (B) from gold nanoparticles conjugated with BODIPY-PEG expressed as wt%. Release in 0 mM glutathione (GSH) for control (AuNP-BODIPY) and 5 and 10 mM GSH for AuNP-BODIPY-PEG samples.
Abbreviation: AuNP, Gold nanoparticles; PEG, poly(ethylene glycol).
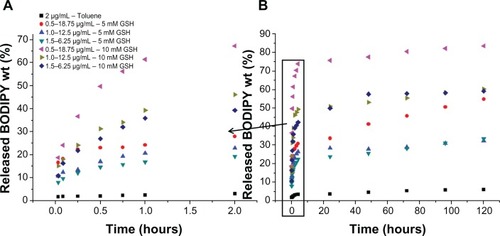
Figure S1 Fourier transform infrared absorbance spectra for 25 μg/mL PEG capped gold nanoparticles.
Abbreviations: AuNPs, gold nanoparticles; PEG, poly(ethylene glycol).
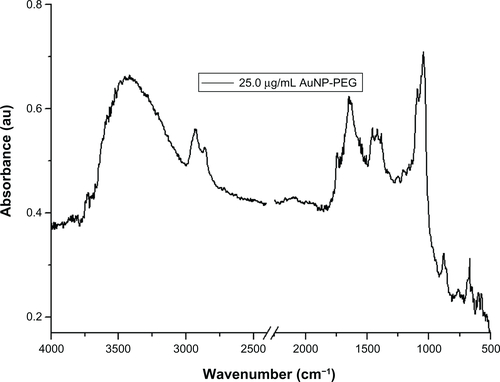
Figure S2 Fourier transform infrared absorbance spectra for 1.0 μg/mL and 2.0 μg/mL of BODIPY® on the surface of gold nanoparticles.
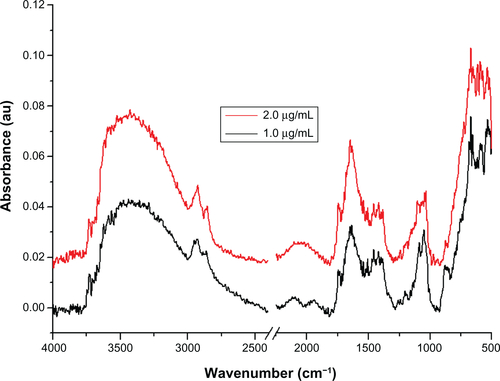
Figure S3 Ultraviolet-visible absorbance spectra for gold nanoparticles conjugated with PEG (25.0 μg/mL), stability in 10 mM glutathione (GSH).
Abbreviations: PEG, poly(ethylene glycol); AP, as prepared sample and in GSH after 60 minutes.
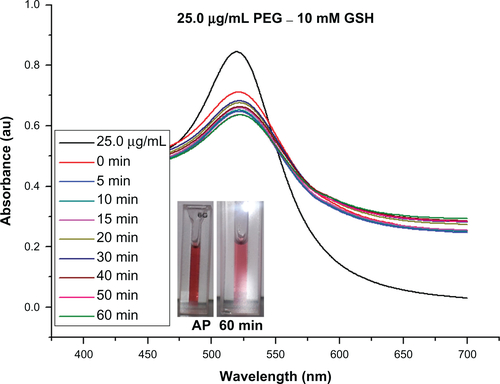
Figure S4 Ultraviolet-visible absorbance spectra for gold nanoparticles capped with BODIPY® (2.0 μg/mL), and their stability in 5 mM glutathione (GSH) (samples show as prepared [AP] and GSH in 60 minutes).
![Figure S4 Ultraviolet-visible absorbance spectra for gold nanoparticles capped with BODIPY® (2.0 μg/mL), and their stability in 5 mM glutathione (GSH) (samples show as prepared [AP] and GSH in 60 minutes).](/cms/asset/cfc5fd10-1fe3-4a7b-b729-ec91980489af/dijn_a_33726_sf0004_c.jpg)
Figure S5 Ultraviolet-visible absorbance spectra for stability of as-prepared gold nanoparticles in 5 mM and 10 mM glutathione solution (samples show as prepared [AP] and in GSH after 60 minutes).
Abbreviations: AuNPs, gold nanoparticles; PEG, poly(ethylene glycol).
![Figure S5 Ultraviolet-visible absorbance spectra for stability of as-prepared gold nanoparticles in 5 mM and 10 mM glutathione solution (samples show as prepared [AP] and in GSH after 60 minutes).Abbreviations: AuNPs, gold nanoparticles; PEG, poly(ethylene glycol).](/cms/asset/b1966899-109b-4b59-a338-43676b6a9063/dijn_a_33726_sf0005_c.jpg)
Figure S6 Ultraviolet-visible absorbance spectra for stability of gold nanoparticles conjugated with 0.5 and 2.0 μg/ml of BODIPY® in 10 mM glutathione. (samples show as prepared [AP] and in GSH after 60 minutes).
Abbreviation: GSH, glutathione.
![Figure S6 Ultraviolet-visible absorbance spectra for stability of gold nanoparticles conjugated with 0.5 and 2.0 μg/ml of BODIPY® in 10 mM glutathione. (samples show as prepared [AP] and in GSH after 60 minutes).Abbreviation: GSH, glutathione.](/cms/asset/931efb53-27e1-4758-8a88-01cbfe712ae3/dijn_a_33726_sf0006_c.jpg)
Figure S7 Ultraviolet-visible absorbance spectra for stability of gold nanoparticles conjugated with 1.0–12.5 μg/ml of BODIPY®-PEG in 5 and 10 mM glutathione. (AP-As Prepared Sample and in GSH after 60 minute and on day 5).
Abbreviation: GSH, glutathione.
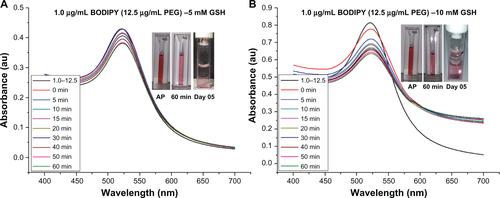
Figure S8 Ultraviolet-visible absorbance spectra for stability of gold nanoparticles conjugated with 1.5–6.25 μg/ml of BODIPY®-PEG in 5 mM and 10 mM glutathione (GSH). As prepared (AP) sample and in GSH after 60 minutes and on day 5.
Abbreviations: PEG, poly(ethylene glycol).
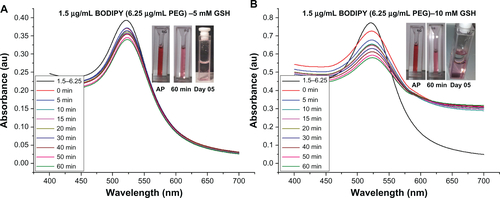
Figure S9 Ultraviolet-visible absorbance spectra for stability of gold nanoparticles conjugated with BODIPY®-PEG (0.5–18.75 μg/mL), and stability in 10 mM glutathione (GSH). As prepared (AP) sample and in GSH after 60 minutes and on day 5.
Abbreviations: PEG, poly(ethylene glycol).
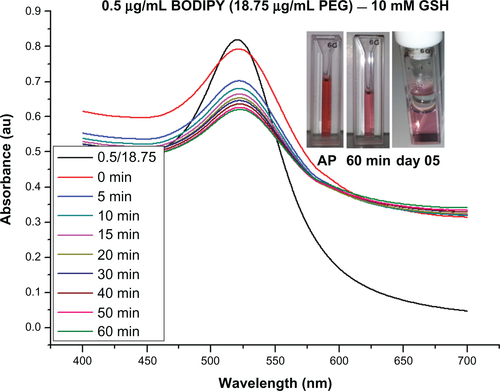
Figure S10 Amount of free BODIPY® present in supernatant after AuNP-BODIPY nanoparticles centrifugation with increasing concentration of BODIPY.
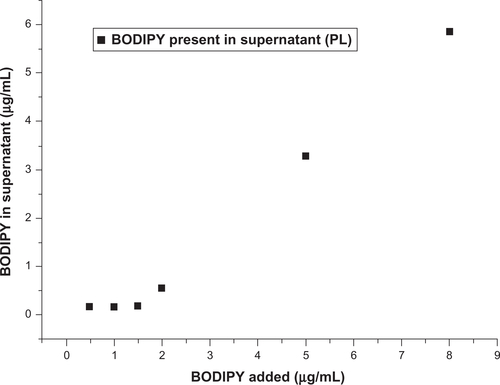
Figure S11 Schematic representation for release of BODIPY® and transfer to the toluene.
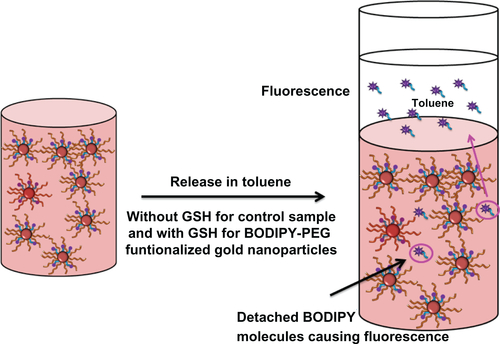
Figure S12 PL count data for AuNPs conjugated with various concentrations of BODIPY-PEG.
Abbreviation: PEG, poly(ethylene glycol).
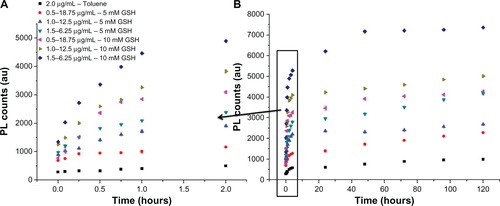
Figure S13 PL count graph for pure BODIPY solution in GSH (0, 5 and 10 mM) and 2.0 μg/mL AuNP-BODIPY (0 mM-GSH) as a control.