Figures & data
Figure 1 Depiction of magnetic nanoparticles. (A) A photograph of nanoparticles under dehydrated condition by scanning electron microscope (100,000X). (B) Illustration of a magnetic Fe3O4 nanoparticle coated with dextran and anti-CRP or ant-PCT antibodies.
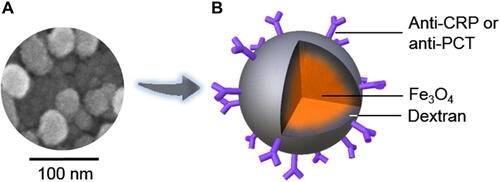
Figure 2 Illustration of the association between CRP and PCT and magnetic nanoparticles coated with anti-CRP or anti-PCT antibodies in the IMR assay. (A) Under the applied external alternating current magnetic fields, the magnetic nanoparticles oscillated and spun individually. (B) The magnetic nanoparticles became larger and clustered after binding with CRP or PCT, and thus oscillated and spun much slower than the original individual magnetic nanoparticles.
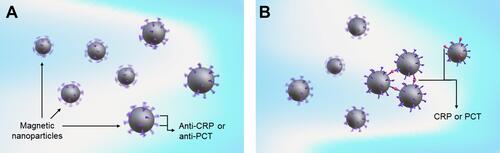
Figure 3 Magnitude and distribution of the anti-CRP and anti-PCT magnetic reagents determined by dynamic laser scattering. (A) The reagent with anti-CRP antibodies. (B) The reagent with anti-PCT antibodies.
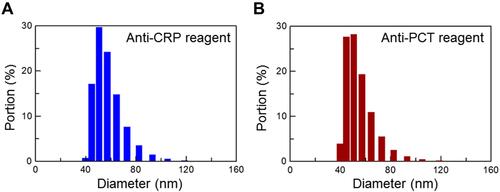
Table 1 The Mean Value, Standard Deviation and Coefficient of Variation of CRP and PCT
Figure 4 Calibration curves of (A) CRP and (B) PCT concentration-dependent IMR signals.
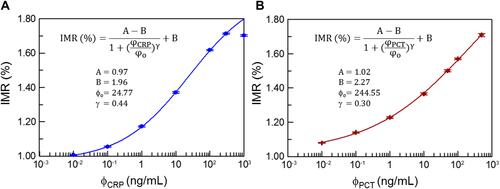
Figure 5 Linearity and dynamic range of assaying (A) CRP and (B) PCT using the IMR assay.
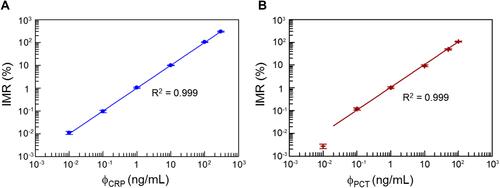
Figure 6 Individual relationships between detected biomarkers. (A) Cervicovaginal secretion PCT vs cervicovaginal secretion CRP, (B) cervicovaginal secretion CRP vs maternal serum WBC, (C) cervicovaginal secretion PCT vs maternal serum WBC, (D) maternal serum CRP vs cervicovaginal secretion CRP, and (E) maternal serum CRP vs maternal serum WBC.
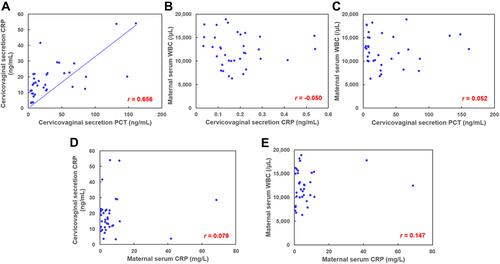
Table 2 Relationships Between Biomarkers and Chorioamnionitis
Table 3 Relationships Between Biomarkers and Early-Onset Neonatal Sepsis
Figure 7 Relationships between various biomarkers and early-onset neonatal sepsis. (A) Cervicovaginal secretion CRP, (B) cervicovaginal secretion PCT, (C) maternal serum CRP, and (D) maternal serum WBC.
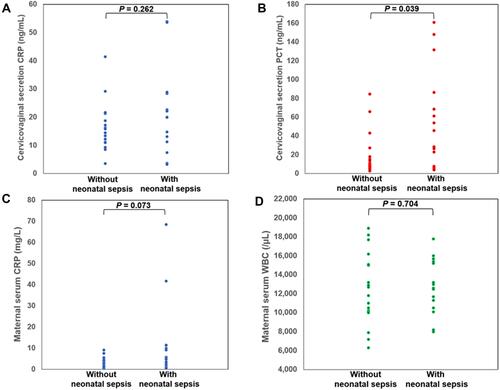
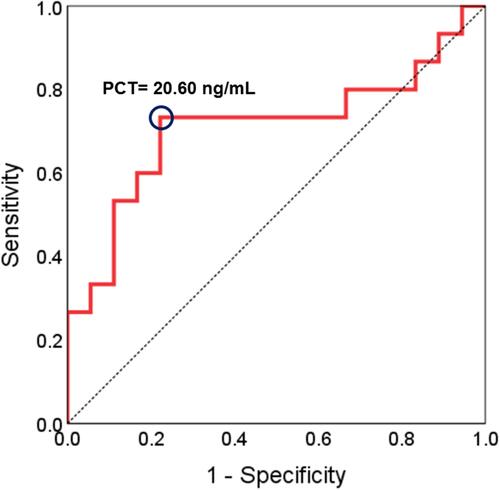
Figure 8 ROC curve of PCT for predicting early-onset neonatal sepsis using the IMR assay. The calculated cut-off PCT level was 20.60 ng/mL, and the area under the ROC curve was 0.71.