Figures & data
Figure 1 The effect of varying concentrations (0.08–800 ng/mL = 0.1–100 nM) of poly-C60 and nepo-C60 on the proliferative response of PBMC from 20 healthy volunteers measured by the lymphocyte transformation test.
Notes: Individuals values are given. Statistically significant differences on the whole group level comparing the spontaneous and the fullerene-induced proliferation are indicated: *P < 0.05; **P < 0.01.
Abbreviations: SI, stimulation index; 0,00, spontaneous proliferation without antigen; –, median.
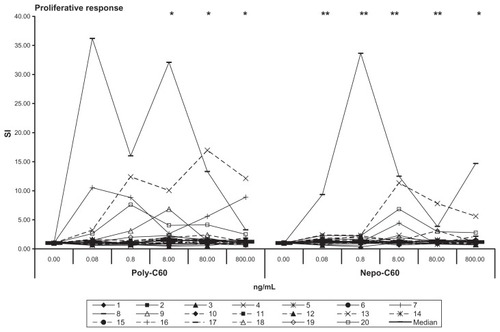
Figure 2 The effect of varying concentrations (0.08–800 ng/mL = 0.1–100 nM) of poly-C60 and nepo-C60 on the IFN-γ production by PBMC from 20 healthy volunteers measured by ELISA.
Notes: Individual values are given. There were no statistical differences on the whole group level comparing the spontaneous and the fullerene-induced IFN-γ production.
Abbreviations: 0, spontaneous IFN-γ production without antigen; –, median.
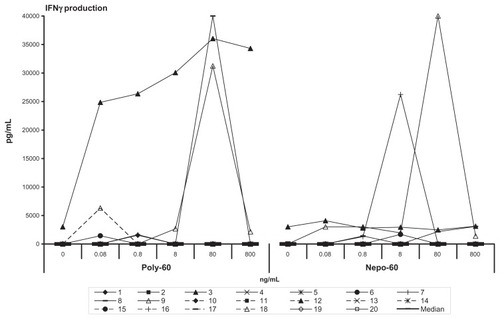
Figure 3 The effect of varying concentrations (0.08–800 ng/mL = 0.1–100 nM) of poly-C60 and nepo-C60 on the IL-10 production by PBMC from 18 healthy volunteers measured by ELISA.
Notes: Two individuals producing already spontaneously high levels of IL-10 were omitted. Individual values are given. There were no statistical differences on the whole group level comparing the spontaneous and the fullerene-induced IL-10 production.
Abbreviations: 0, spontaneous IL-10 production without antigen; –, median.
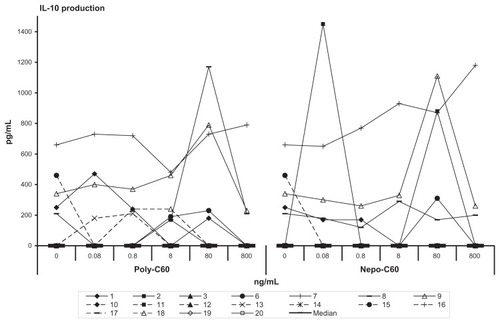
Figure 4 The effect of varying concentrations (0.08–800 ng/mL = 0.1–100 nM) of poly-C60 and nepo-C60 on the IL-6 production by PBMC from 17 healthy volunteers measured by ELISA.
Notes: Three individuals producing already spontaneously high levels of IL-6 were omitted. Individual values are given. Statistically significant differences on the whole group level comparing the spontaneous and the fullerene-induced IL-6 production are indicated: *P < 0.05.
Abbreviations: 0, spontaneous IL-6 production without antigen; –, median.
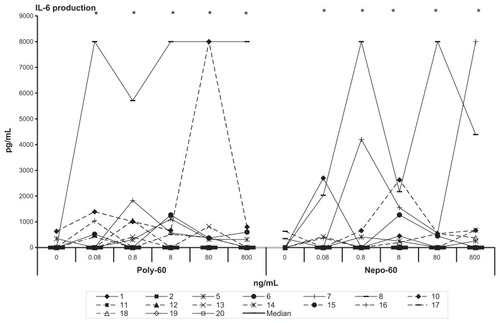
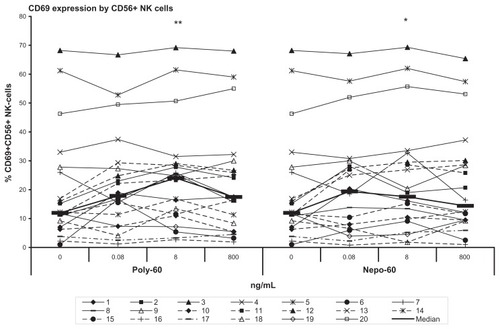
Figure 5 The effect of varying concentrations (0.08–800 ng/mL = 0.1–100 nM) of poly-C60 and nepo-C60 on activation of NK-cells measured by CD69 expression by flow cytometry with PBMC from 20 healthy volunteers.
Notes: Individual values are given. Statistically significant differences on the whole group level comparing the spontaneous and the fullerene-induced CD69 expression are indicated: *P < 0.05; **P < 0.01.
Abbreviations: 0, spontaneous CD69 expression without antigen; –, median.