Figures & data
Table 1 Primer Sequences Used for qRT-PCR Analysis in This Study
Figure 1 Synthesis and optimization of HHT-AuNPs. (A) Schematic illustration of AuNPs synthesis using HHT; (B) optimization of reaction condition, including HHT concentration (a), temperature (b), reaction time (c), gold salt concentration (d), and pH (e) for the large-scale bioreduction of HAuCl4•3H2O.
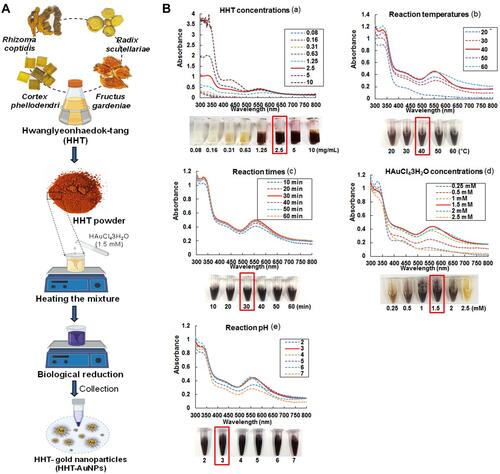
Figure 2 Characterization of HHT-AuNPs. (A) UV–Vis absorption spectroscopy analysis of synthesized HHT-AuNPs and HHT; (B) TEM micrograph of HHT-AuNPs in which the scale bar represents 200 nm, 50 nm and 5 nm (a); Gold distribution (elemental mapping, b) and energy-dispersive X-ray spectroscopy analysis (EDX, c); (C) FE-SEM pattern (a) and gold distribution (b) of HHT-AuNPs; (D) selected area diffraction pattern (left) and X-ray diffraction (XRD) pattern (right); (E) size distribution of the nanoparticles using dynamic light scattering (DLS) with respect to intensity, number, and volume.
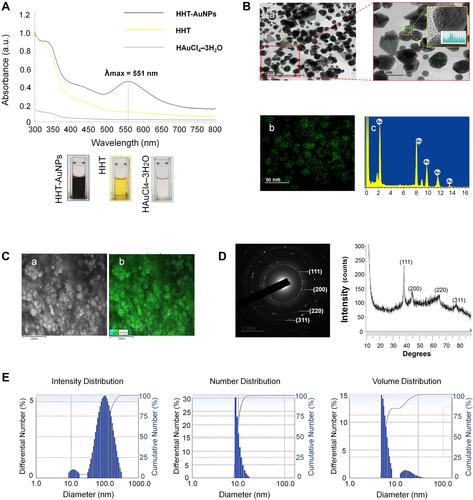
Figure 3 Complexation of HHT-phytochemicals onto the surface of HHT-AuNPs. (A) FTIR spectra of HHT and HHT-AuNPs; (B) a tabular view of the functional group profile; (C) thermogravimetric analysis (TGA) curves of HHT and HHT-AuNPs.
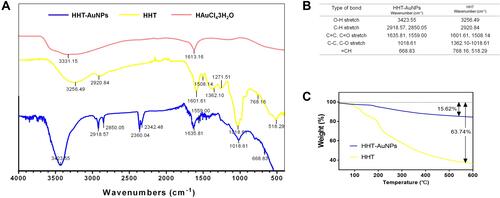
Table 2 The Contents of Marker Compounds in HHT Extract and HHT-AuNPs
Figure 4 Uptake and cytotoxicity of HHT-AuNPs in macrophages. (A) Bio-TEM images, representative TEM images of HHT-AuNPs cellular uptake are presented in the enlarged images (lower) from the line squares, the yellow arrows pointed to accumulation of HHT-AuNPs, the “C” and “N” indicate nucleoplasm (N) and cytoplasm (C), respectively; (B) effects of HHT and HHT-AuNPs on viability in RAW264.7 cells; (C) fluorescent images of RAW264.7 cells following live/dead and Hoechst 33258 staining. All values are expressed as mean ± S.D. *p < 0.05 vs control group.
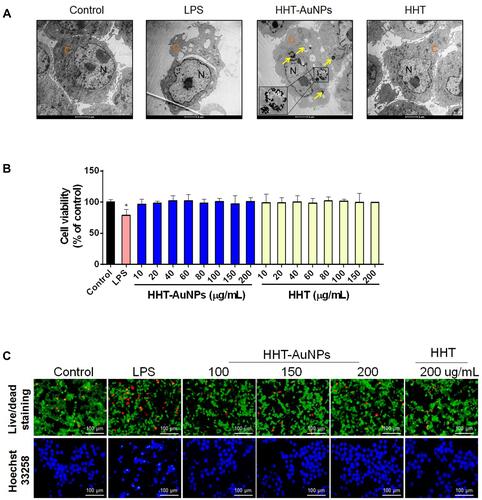
Figure 5 Immunostimulatory activity of HHT-AuNPs on macrophages. (A) Morphological characteristics of RAW264.7 cells after HHT-AuNPs and HHT treatment, the red arrows pointed differentiated RAW264.7 cell; (B) NO production; (C) mRNA expression levels for each targeted cytokine in RAW264.7 cells; (D) TNF-α and IL-1β levels in the culture media of RAW264.7 cells. All values are expressed as mean ± S.D. *p < 0.05, **p < 0.01 vs control group.
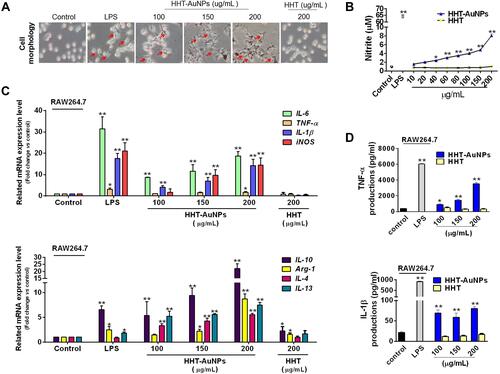
Figure 6 HHT-AuNP-mediated immunostimulation of RAW264.7 cells by activation of the NF-κB and MAPK signaling pathways. (A) Immunoblotting of ERK, JNK, and p38 proteins in RAW264.7 cells; (B) immunoblotting of IκBα and NF-κB proteins in RAW264.7 cells. All values are expressed as mean ± S.D. *p < 0.05, **p < 0.01 vs control group.
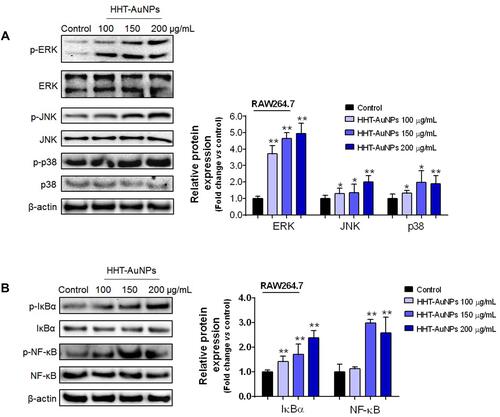
Figure 7 HHT-AuNP-triggered splenocyte proliferation. (A) Effects of increasing concentration of HHT-AuNPs on viability of splenocytes; (B) effects of HHT-AuNPs on cell viability at different times; (C) NO production in splenocytes at different time points. All values are expressed as mean ± S.D. **p < 0.01 vs control group.
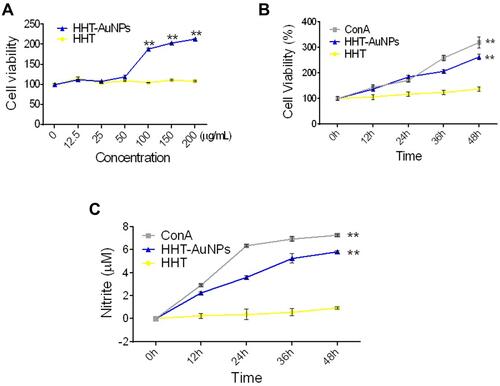
Figure 8 Immunostimulatory effects of HHT-AuNPs on mouse splenocytes. (A) Analysis of mRNA expression levels (TNF-α, IL-1β, IL-4, IL-6, IL-10, and IL-12) after HHT-AuNPs or HHT treated in splenocytes at different times; (B) TNF-α, IL-1β, IFN-γ, and IL-2 levels in the culture media of splenocytes. (C) Effect of HHT-AuNPs on immunoglobulin (IgG and IgA) levels in splenocytes. All values are expressed as mean ± S.D. *p < 0.05, **p < 0.01 vs control group.
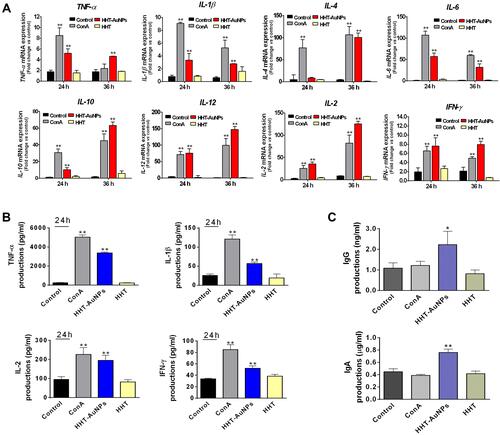
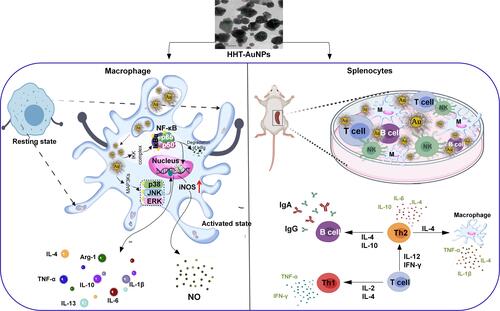
Figure 9 Mechanism of immunoenhancing action of HHT-AuNPs in macrophages and splenocytes.