Figures & data
Figure 1 Decoration and detection of BMPs with a scaffold fusion protein. (A) Composition (schematic) of recombinant affibody (RA) protein. (B) Purified RAs were separated by SDS-PAGE and analyzed by western blotting with anti-FLAG tag Abs. (C) ELISA with rabbit anti-goat IgG-HRP (IgG-H+L) and rabbit anti-goat Peroxidase-AffiniPure F(ab’)2 Fragment (IgG-Fab) was used to detect the RA binding site of Ab (n=3), CK: control check (no RA added). (D) EM images of M. gryphiswaldense MSR-1 (yellow arrows indicate BMPs) and purified BMPs. (E) SDS-PAGE analysis of RA complexed with BMP membrane (BMP-RA). (F) ELISA analysis of BMP-RA binding to rabbit anti-mouse IgG-HRP (n=3). ****P <0.0001.
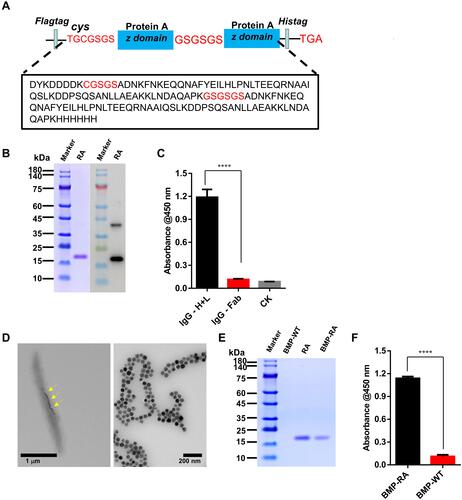
Figure 2 Glutaraldehyde (GA) and RA complexes with TZ/BMP (BMP-GA-TZ, BMP-RA-TZ). (A) SDS-PAGE analysis showing presence of TZ on BMP-RA-TZ and BMP-GA-TZ surfaces. (B) TZ quantities, detected by enhanced BCA protein assay kit, similar for BMP-RA-TZ and BMP-GA-TZ (n=3). (C) Orientation of TZ (schematic) on BMP-RA-TZ and BMP-GA-TZ. (D) ELISA analysis of HER2-binding capacity of BMP-RA-TZ and BMP-GA-TZ (n=3), CK: no BMPs added. ***P <0.001; ****P <0.0001.
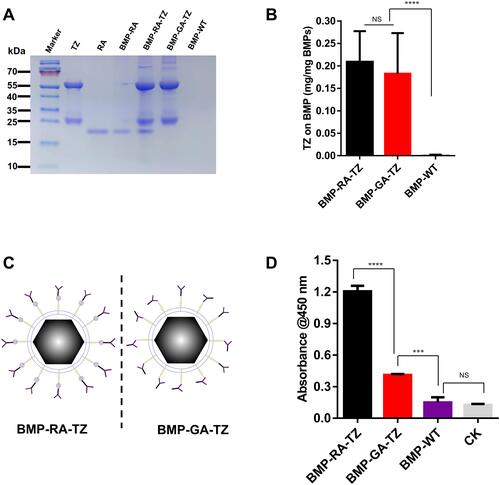
Figure 3 Protein corona identification and classification. (A) SDS-PAGE analysis of plasma proteins obtained from BMP-RA-TZ and BMP-GA-TZ following incubation with plasma and IgG plasma. (B and C) Classification based on MW of proteins obtained from BMP-RA and BMP-GA following incubation with plasma and IgG plasma. Average protein MW was higher for BMP-GA-TZ-plasma than for BMP-RA-TZ-plasma. (D) Hydrate particle size analysis of BMPs, BMP-plasma complex, and BMP-IgG plasma complex (n=3). (E) Zeta potential of BMPs, BMP-plasma complex, and BMP-IgG plasma complex (n=3). (F) ELISA analysis of HER2-binding capacity of BMP-RA-TZ and BMP-GA-TZ before and after incubation with plasma and IgG plasma (n=3). *P <0.05; **P <0.01; ***P <0.001; ****P <0.0001.
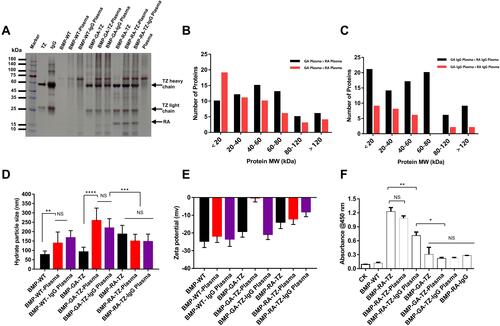
Figure 4 Analysis of SK-BR-3 cell uptake of BMPs by CLSM and flow cytometry. (A) CLSM of SK-BR-3 incubated with BMP-RA-TZ and BMP-GA-TZ before and after incubation with plasma and IgG plasma, Scale bar, 5 μm. (B) Percentage (by flow cytometry) of FITC-positive SK-BR-3 after incubation with BMP-RA-TZ and BMP-GA-TZ. (C) Same as (B), using BMP-RA-TZ plasma and BMP-GA-TZ plasma. (D) Same as (B), using BMP-RA-TZ IgG plasma and BMP-GA-TZ IgG plasma. ***P <0.001; ****P <0.0001.
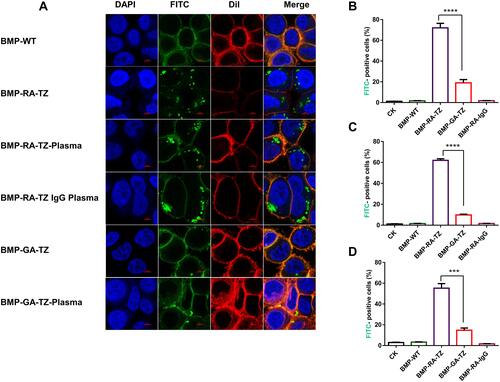
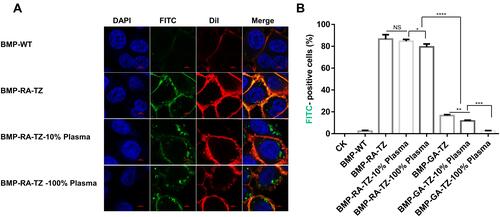
Figure 5 Efficiency of BMP-RA-TZ uptake by SK-BR-3 cells at three plasma concentrations. (A) CLSM analysis of SK-BR-3 following incubation with BMP-RA-TZ at three plasma concentrations (0%, 10%, 100%). (B) Percentages (by flow cytometry) of FITC-positive cells for various conditions, scale bars 5 μm. *P <0.05; **P <0.01; ***P <0.001; ****P <0.0001.