Figures & data
Figure 1 Synthesis and characterization of I@BM NVs. (A) TEM image of I@BM NVs. (B) PDI of I@BM NVs. (C) UV/Vis spectra of free ICG, and I@BM NPs in PBS. (D) Zeta potentials and DLS of I@BM NVs at different time point. (E) The release profile of ICG from I@BM NVs. (F) The photostability of free ICG and I@BM NVs. Data are expressed as mean ± SD.
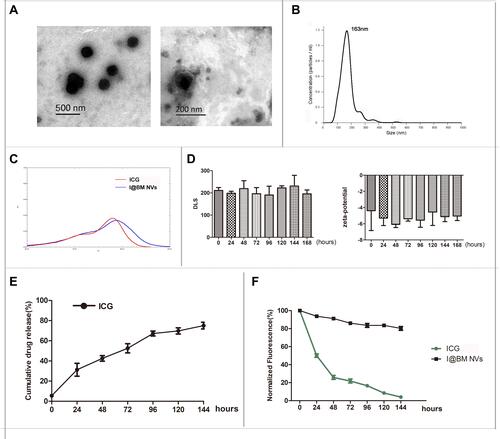
Figure 2 Validation and internalization of I@BM NVs. (A) SDS-PAGE analysis of cell membrane extraction and I@BM NVs. Both samples were concentrated to ensure distinct protein bands. (B) Western blot assay for the identification of membrane-specific and intracellular protein markers in whole cell lysate, extracted membranes, and I@BM NVs. H3, Histone H3; COXIV, cytochrome c oxidase subunit IV; GAPDH, glyceraldehyde-3-phosphate dehydrogenase. (C) Flow cytometry analysis showing internalization of DiD-labeled B16 cell membrane in different cells after 2 h incubation. Quantification of the mean fluorescence intensities of the histograms. Bars represent means ± SD (n = 3). P values ≤0.05 were considered to be statistically significant (***P < 0.001).
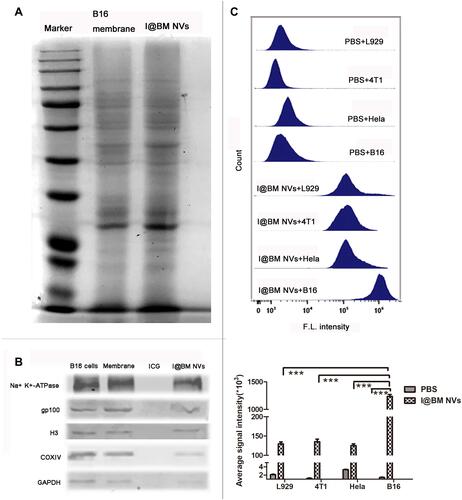
Figure 3 Cell apoptosis analysis in vitro. (A) Flow cytometry analysis of intracellular ROS generation. (B) Cell viability of B16 cells incubated with various concentrations of free ICG and I@BM NVs under NIR. (C) Irradiated B16 cells stained with annexin V and PI for FACS analysis. (D) Caspase-9 and BAX protein levels estimated by western blot analysis. Data are expressed as mean ± SD. *, ** and ***Indicate significant levels at P < 0.05, P<0.01 and P < 0.001, respectively.
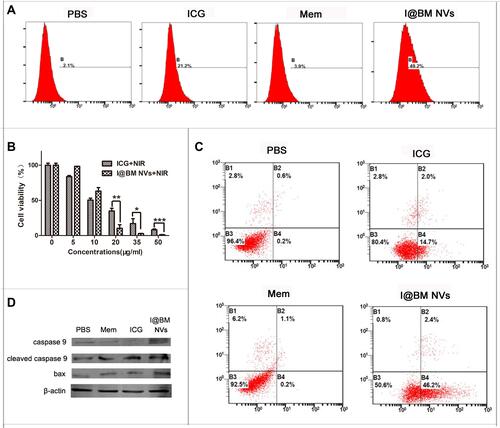
Figure 4 In vivo imaging of I@BM NVs. (A) Representative images of ICG and I@BM NVs at 0 min, 1 h, 3 h, 6 h, and 24 h. (B) Tumors and major organs after injection of free ICG and I@BM NVs at 24 h postinjection. I@BM NVs realized ideal tumor accumulation with reduced interception by the kidney and liver. And the semi-quantitative biodistribution of free ICG, I@BM NVs in nude mice was concluded by the averaged fluorescence intensity of each organ. The data are shown as mean ± SD (n = 3); **Indicates P < 0.01.
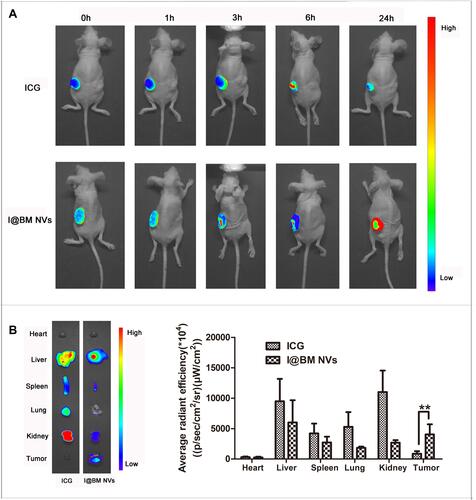
Figure 5 Therapeutic efficacy of I@BM NVs in vivo. (A) tumor volumes of melanoma-bearing mice after different treatments. Data are expressed as mean ± SD. * indicates P < 0.05. (B) Survival curve; each group involved 10 mice. * indicates P < 0.05. (C) Body weights of mice. Data are expressed as mean ± SD. (D) H&E staining of liver and kidneys tumors obtained from tumor-bearing mice (scale bar = 20 mm).
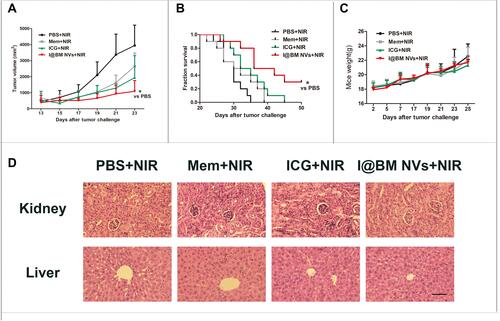
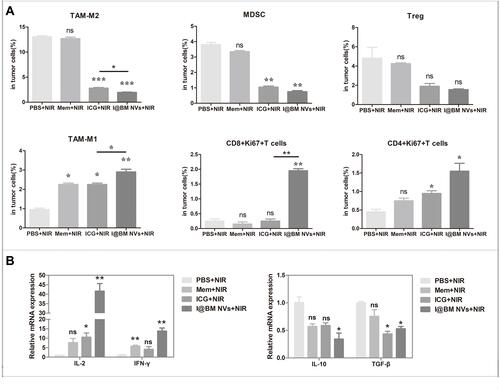
Figure 6 Evaluation of tumor microenvironment immunological markers. (A) Percentages of intra-tumoral immune-inhibitive (tumor-associated macrophage 2 (TAM-M2), Treg, MDSC) and immune-promoting (TAM-M1, CD4+Ki67+T, CD8+Ki67+T) cells analyzed using flow cytometry. (B) Relative mRNA expression of pro-tumoral and anti-tumoral cytokines analyzed using qRT-PCR. Data are expressed as mean ± SD. *, ** and ***Indicate significant levels at P < 0.05, P<0.01 and P < 0.001, respectively. Ns indicate not significant levels at P>0.05.