Figures & data
Figure 1 Morphology and composition analysis of ultrafine calcium oxalate dihydrate microcrystals by (A) scanning electron microscopy (scale bar = 1 μm), (B) X-ray diffraction, and (C) Fourier transform infrared spectroscopy.
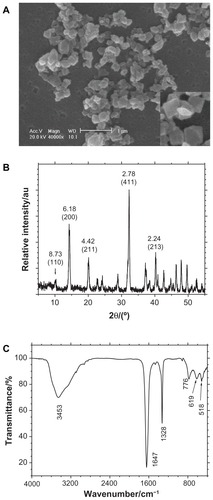
Figure 2 Scanning electron microscope images (scale bar = 10 μm) after the adhesion of calcium oxalate dihydrate with African green monkey kidney epithelial cells in the control group at (A) 2 hours, (B) 6 hours, (C) 12 hours, and (D) 24 hours.
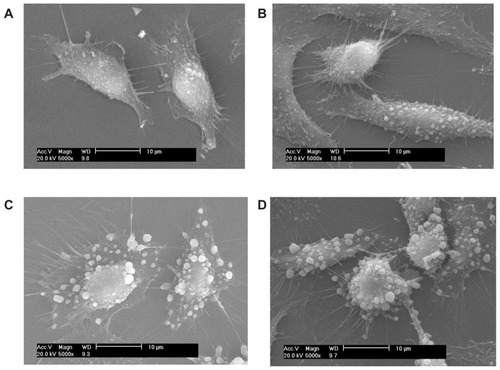
Figure 3 Scanning electron microscope images (scale bar = 10 μm) after the adhesion of calcium oxalate dihydrate with African green monkey kidney epithelial cells in the injury group at (A) 2 hours, (B) 6 hours, (C) 12 hours, and (D) 24 hours.

Figure 4 Changes in (A) cell viability, (B) malonaldehyde content, (C) osteopontin expression, and (D) zeta potential during the adhesion process between calcium oxalate dihydrate microcrystals and African green monkey kidney epithelial cells in both the control and injury groups.
Notes: *P < 0.05; #P < 0.01 compared with cells not exposed to calcium oxalate dihydrate microcrystals.
Abbreviations: h, hour; MDA, malonaldehyde.
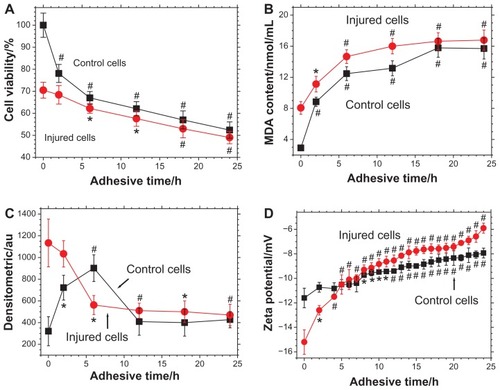
Figure 5 Laser scanning confocal microscope images (630×) showing fluorescent changes in osteopontin on African green monkey kidney epithelial cells after the adhesion of calcium oxalate dihydrate with the epithelial cells in the control group at (A) 0 hours, (B) 6 hours, (C) 12 hours, and (D) 24 hours. Note: The nucleus is blue, and the expressed osteopontin is green.
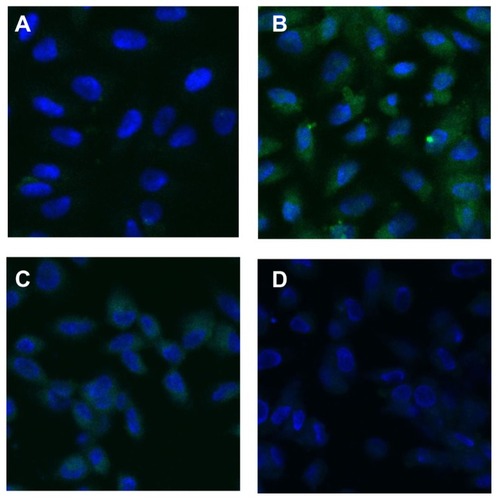
Figure 6 Laser scanning confocal microscope images (×630) showing fluorescent changes of osteopontin on African green monkey kidney epithelial cells after the adhesion of calcium oxalate dihydrate with the epithelial cells in the injury group at (A) 0 hours, (B) 6 hours, (C) 12 hours, and (D) 24 hours.
Note: The nucleus is blue, and the expressed osteopontin is green.
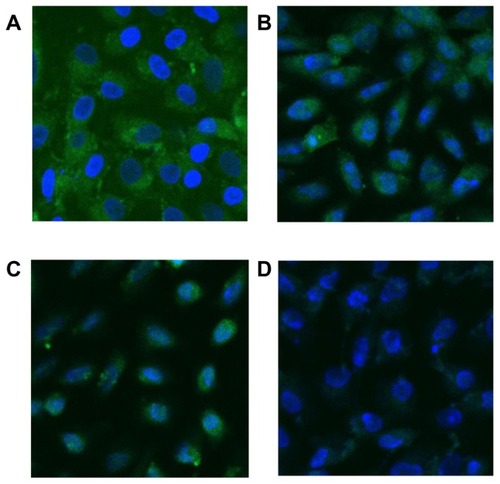
Figure 7 Scanning electron microscope images (scale bar = 2 μm) of the calcium oxalate dihydrate crystals endocytosed by African green monkey kidney epithelial cells in the (A and B) control group and (C and D) injury group after adhesion at (A and C) 6 hours and (B and D) 24 hours.
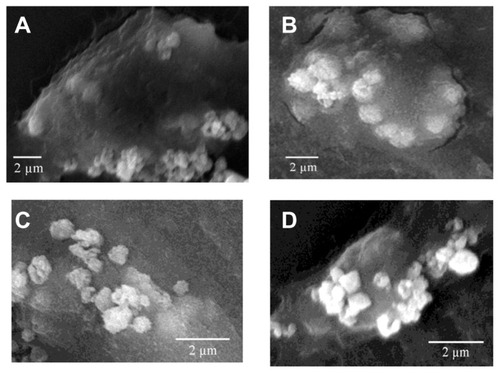
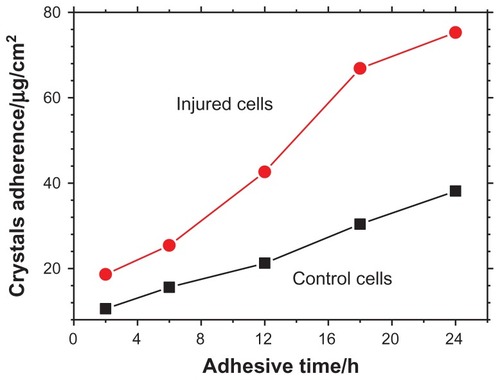
Figure 8 The amount of calcium oxalate dihydrate microcrystals that adhered on the cell surface at different adhesive times.
Abbreviation: h, hour.