Figures & data
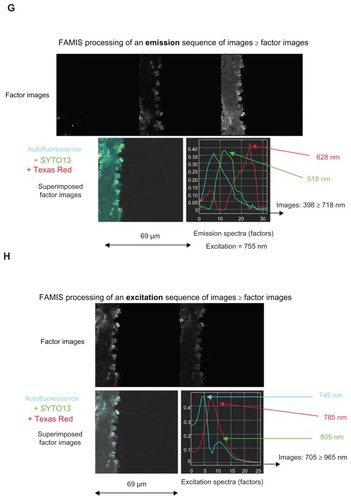
Figure 1 Basic presentation of FAMIS, which was developed to process biomedical image sequences.Citation2,Citation3 A similar description of FAMIS applied to spectral emission was provided in Kahn et alCitation10
Notes: In the present case, FAMIS assumes that each pixel is a mixture of different fluorescence patterns.Citation5 Factor curves correspond to spectral emissionsCitation13,Citation15 of the different fluorochromes on the slide. Here, factor curves correspond to spectral excitations of the fluorochromes. For each factor curve, the set of positive weights computed for each curve yields one image, called a factor image, which provides images of fluorescent structures. Factors are estimated in a two-step procedure from the image sequence. In the first step, called correspondence analysis, the image is reconstituted using singular vectors associated with the largest singular values. The second step, called oblique analysis, aims to estimate factor curves representing the fundamental curves. In the case of multispectral analysis, factor curves are selected by positive constraints to obtain positive factor curves and images. Factor images are recomputed back to the original sampling by oblique projection on the factor curves, and the estimation is performed in the least-squares sense. An algorithmic description of FAMIS is provided in a previous publication.Citation16 This presentation is an adaptation of a published figure reprinted from International Journal of Nanomedicine, 5, Kahn E, Baarine M, Pelloux S, et al. Iron nanoparticles increase 7-ketocholesterol-induced cell death, inflammation, and oxidation on murine cardiac HL1-NB cells, 185–195, copyright (2010), with permission from Dove Medical Press Ltd.Citation10 It mentions excitation profiles, and images and factor curves are different.
Abbreviation: FAMIS, factor analysis of medical image sequences.
Figure 2 Spectral observations of FTR (FITC + Texas Red) beads in which (A) emission and (B) excitation sequences are collected and processed by FAMIS.
Abbreviation: FAMIS, factor analysis of medical image sequences.
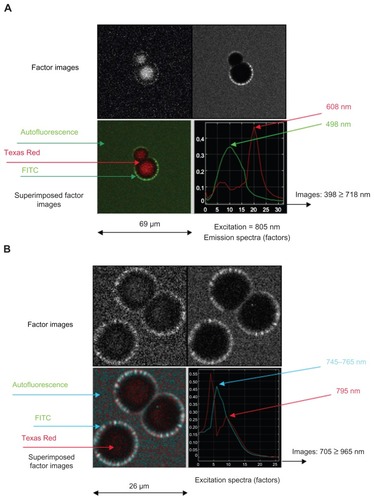
Figure 3 Spectral observations of iron nanoparticles conjugated with Texas Red (MACS Texas Red) in which (A) emission and (B) excitation sequences are collected through band-pass filters and processed by FAMIS.
Note: Color was added to assist with interpretation.
Abbreviation: FAMIS, factor analysis of medical image sequences.
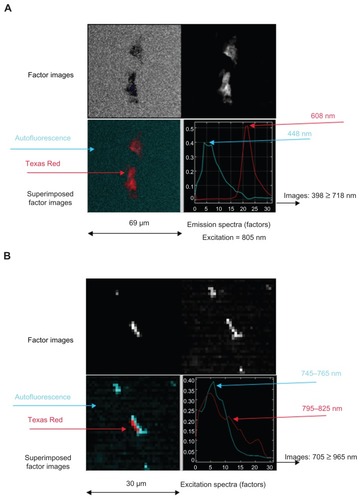
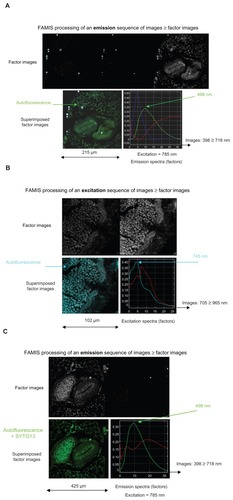
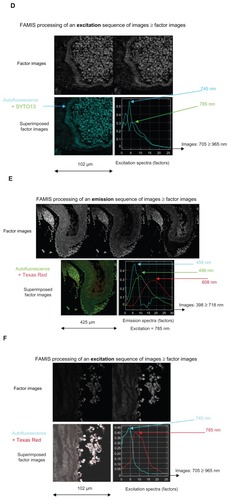
Figure 4 Spectral observation via FAMIS of the action of injected MRC Texas Red iron nanoparticles in the thoracic aorta of mice, including (A and B) control samples with no injection and no staining; (C and D) control samples counterstained with SYTO13; (E and F) injected samples with no staining; and (G and H) injected, counterstained samples.
Notes: Of each pair, the former shows emissions (398–718 nm) and the latter shows excitations (705–965 nm). Color was added to assist with interpretation.
Abbreviation: FAMIS, factor analysis of medical image sequences.