Figures & data
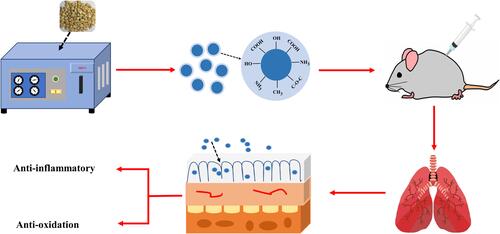
Figure 1 The flowchart for the preparation process of ASAC-CDs.
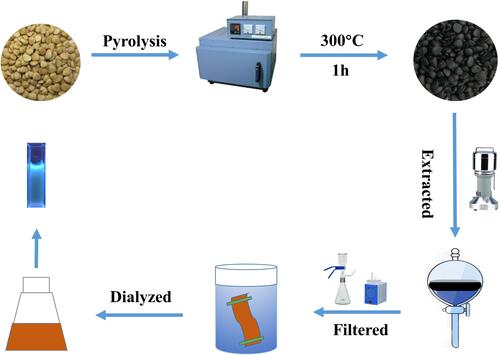
Figure 2 High-performance liquid chromatography (HPLC) fingerprint of (A) ASA (the dry mature seeds of Prunus armeniaca L.) and (B) Armeniacae Semen Amarum Carbonisata.
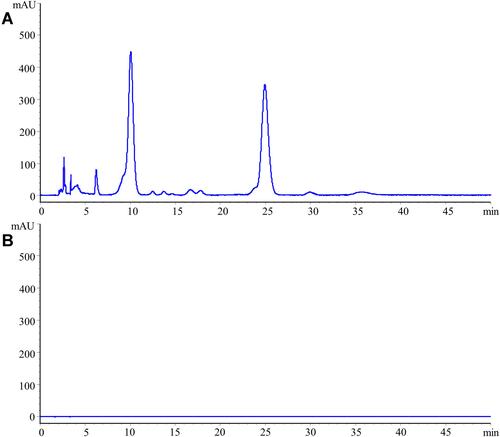
Figure 3 Characterization of ASAC-CDs: (A) Transmission electron microscopy (TEM) images of ASAC-CDs displaying ultra-small particles. (B) Particle size distribution histogram of ASAC-CDs. (C) High-resolution TEM image of ASAC-CDs and lattice spacing of ASAC-CDs (in the middle). (D) X-ray diffraction pattern. (E) Ultraviolet–visible spectrum. (F) Fluorescence spectra for excitation and emission. (G) Fluorescence spectra of ASAC-CDs with different excitation wavelengths. (H) Fourier transform infra-red spectrum.
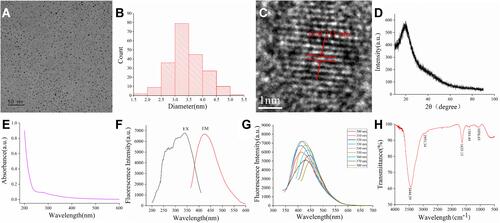
Figure 4 The surface composition and elemental analysis of the prepared ASAC-CDs by XPS. (A) X-ray photoelectron spectroscopy survey of ASAC-CDs. (B) C1s. (C) O1s and (D) N1s.
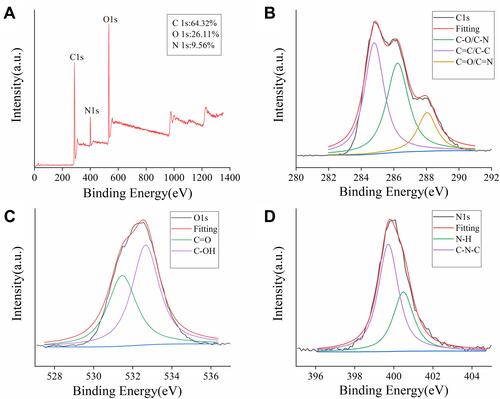
Figure 5 Effect of different concentrations of ASAC-CDs on the viability of A549 cells. Significantly different compared to the control group at **p < 0.01.
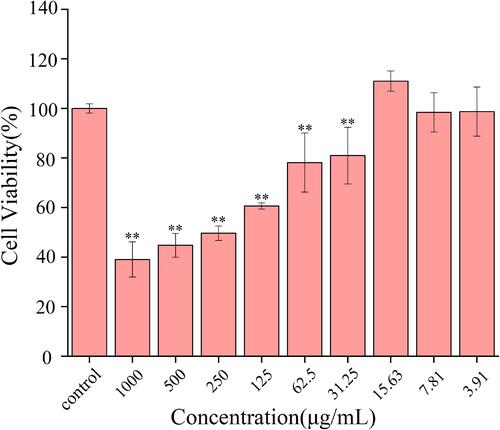
Figure 6 Macroscopic images of ASAC-CDs ameliorating an LPS-induced acute lung injury (ALI) in rats. (A) Normal saline group; (B) model group; (C) positive control group; (D) high-dose ASAC-CDs group; (E) medium-dose ASAC-CDs group; and (F) low-dose ASAC-CDs group.
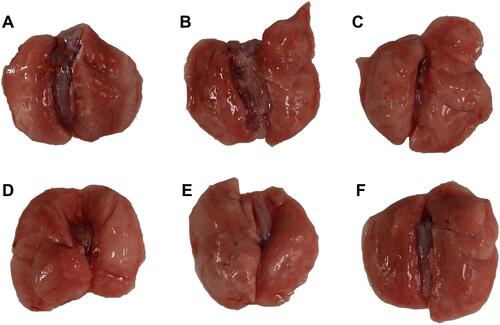
Figure 7 ASAC-CDs ameliorate LPS-induced lung histopathological damage. (A) Effects of ASAC-CDs on histopathological changes in lung tissues in LPS-induced ALI rats (magnification=50 x). Histopathological sections of lung tissue were stained with H&E. (i) normal saline group; (ii) model group; (iii) positive control group; (iv) high-dose ASAC-CDs group; (v) medium-dose ASAC-CDs group; and (vi) low-dose ASAC-CDs group. (B) Pathological score of the ALI model induced with LPS in rats treated with normal saline (NS), LPS (Model), dexamethasone (DM), and high (H), medium (M), and low (L) doses of ASAC-CDs (3.75, 1.88 and 0.94 mg/kg, respectively). Significantly different compared with the control group at ##p < 0.01, significantly different compared to the model group at **p < 0.01.
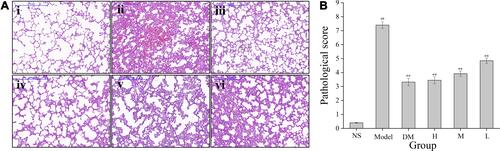
Figure 8 Serum concentrations of (A) IL-6, (B) IL-1β, (C) TNF-α and (D) IL-10 in rats treated with normal saline (NS), LPS (Model), dexamethasone (DM), and high (H), medium (M), and low (L) doses of ASAC-CDs (3.75, 1.88 and 0.94 mg/kg, respectively). Significantly different compared with the control group at ##p < 0.01, significantly different compared to the model group at **p < 0.01 and *p < 0.05.
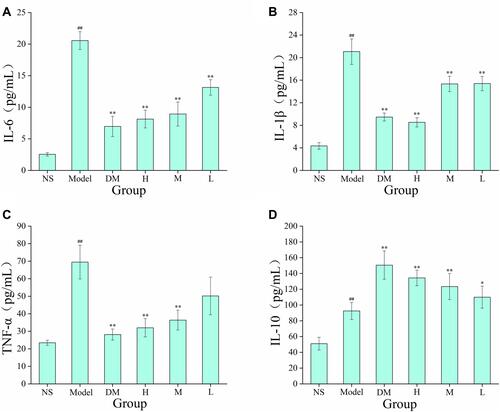
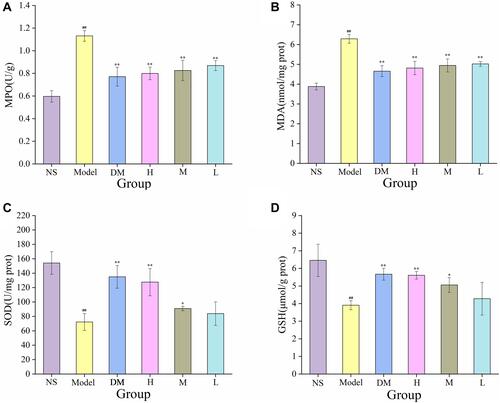
Figure 9 Effects of myeloperoxidase activity and antioxidant levels in the lung tissue. (A) MPO, (B) MDA, (C) SOD and (D) GSH levels in rats treated with normal saline (NS), LPS (Model), dexamethasone (DM), and high (H), medium (M), and low (L) doses of ASAC-CDs (3.75, 1.88 and 0.94 mg/kg, respectively). Significantly different compared with the control group at ##p < 0.01, significantly different compared to the model group at **p < 0.01 and *p < 0.05.