Figures & data
Figure 1 1H-NMR spectrum of CMC.
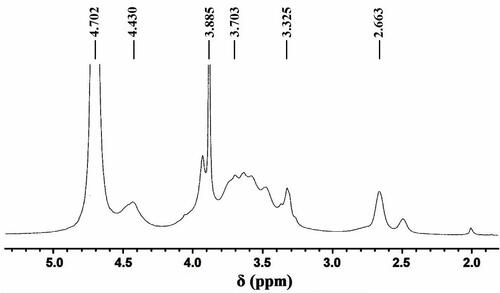
Figure 2 XRD patterns of CMC and amine-MNPs.
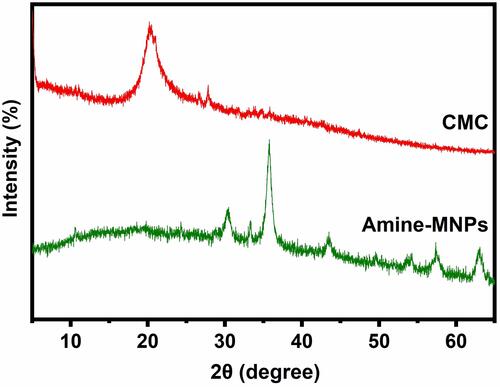
Figure 3 FTIR spectra of (a) CMC, (b) amine-MNPs, (c) DOX, (d) MNPs-CMC and (e) MNPs-CMC-DOX.
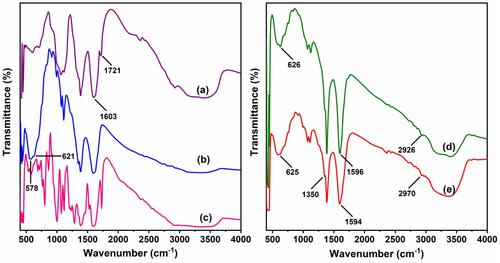
Figure 4 TEM images of (A) amine-MNPs and (B) MNPs-CMC-DOX. Scale bar = 20 nm. SAED patterns of (C) amine-MNPs and (D) MNPs-CMC-DOX. Scale bar = 51 nm.
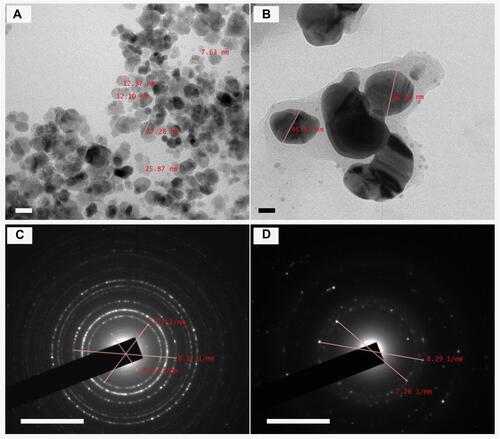
Figure 5 SEM images of (A) amine-MNPs and (B) MNPs-CMC-DOX. The size distribution of (C) amine-MNPs and (D) MNPs-CMC-DOX as determined by DLS.
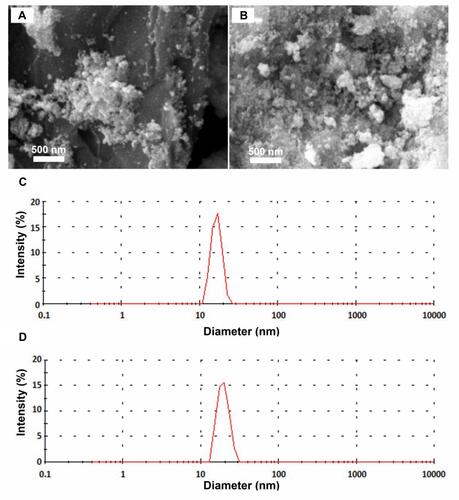
Figure 6 (A) TGA and (B) DSC curves of CMC, amine-MNPs, MNPs-CMC, DOX, and MNPs-CMC-DOX.
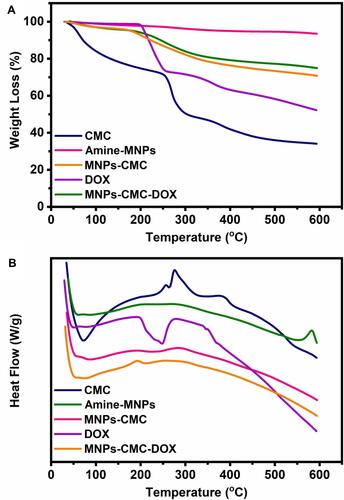
Figure 7 Release patterns of DOX from MNPs-CMC-DOX at (A) 37°C and (B) 25°C.
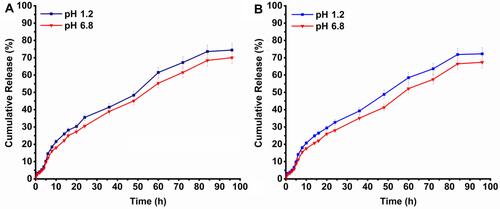
Table 1 Release Kinetic Parameters of MNPs-CMC-DOX at Different pH Values (6.8 and 1.2) and Temperatures (37°C and 25°C)
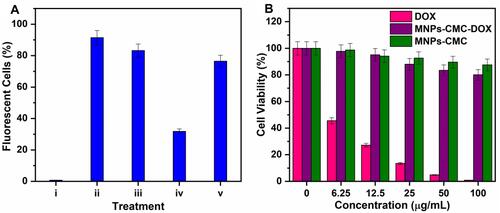
Figure 8 Viability of MCF-7 cells after treatment with (A) DOX, (B) MNPs-CMC-DOX, and (C) MNPs-CMC.
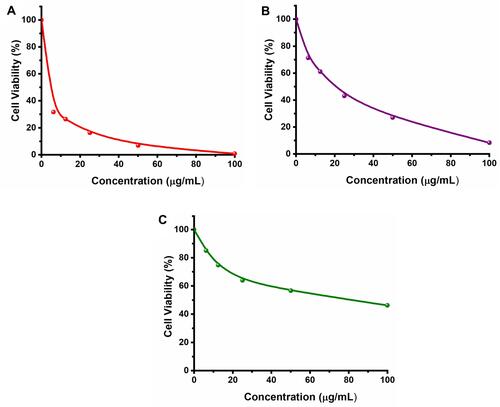
Figure 9 (A) Effect of different treatments on the intracellular ROS level of MCF-7 cells as determined by the H2DCFDA assay: (i) no treatment, (ii) treatment with H2O2, (iii) treatment with DOX, (iv) treatment with MNPs-CMC, and (v) treatment MNPs-CMC-DOX. (B) Viability of 3T3 cells after treatment with DOX, MNPs-CMC-DOX, and MNPs-CMC.