Figures & data
Table 1 The Baseline Characteristics of AMI Patients and Healthy Persons
Figure 1 Exosome characterization and internalization pathways. (A) Transmission electron microscopy images of exosomes isolated from the two groups. Scale bar, 100 nm. (B) Protein expression of the exosomal markers Alix, CD63, and TSG101. (C) Exosome particle diameter distribution. (D) The concentration of exosome between control group and AMI individuals. (E) Exosome uptake was analyzed at the indicated times using flow cytometry. (F) Exosome uptake in human umbilical vein endothelial cells (HUVECs) incubated with PKH67-labeled exosomes (green), as analyzed by confocal imaging. Nuclei were dyed with DAPI (blue). Scale bar, 20 μm.
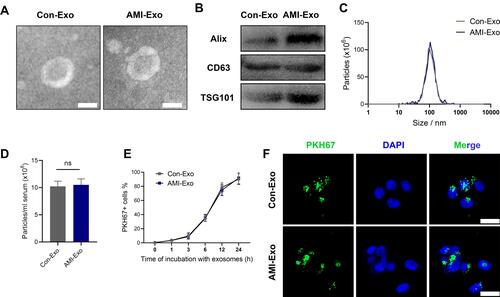
Figure 2 Effects of AMI-Exo and Con-Exo treatment on angiogenesis in vitro and ex vivo. (A and B) Proliferation of EdU-positive HUVECs, as evaluated by CCK8 (C) and manual cell counting (D). Scale bar, 50 μm. (E) Tube formation analysis of vascular formation ability, as measured by tube length (F) and node number (G). Scale bar, 100 μm. Cell migration was quantitated using scratch wound assays (H) and the ratio of the non-migrated area divided by the baseline wound area was analyzed (I). Scale bar, 100 μm. Cell migration was analyzed using Transwell assays (J and K). Scale bar, 50 μm. (L) Aortic sprouting assays were used to quantify the number of microvessels (M). Scale bar, 200 μm. *p < 0.05, **p < 0.01, ***p < 0.001.
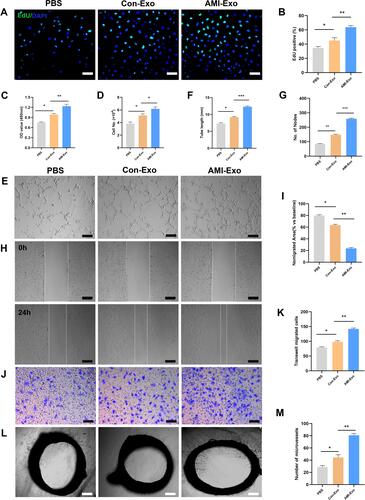
Figure 3 Peripheral serum exosomes from AMI patients were loaded with miR-126-3p. (A–E) The expression level of angiogenesis-related miRNAs in exosomes isolated from the two groups was evaluated using qRT-PCR. (F) Exosomes were added to HUVECs with or without an inhibitor of RNA polymerase II transcription (5,6-dichloro-1-b-D-ribofuranosylbenzimidazole). After treatment for 24 h, miR-126-3p levels in the HUVECs were analyzed. *p < 0.05, **p < 0.01, ***p < 0.001.
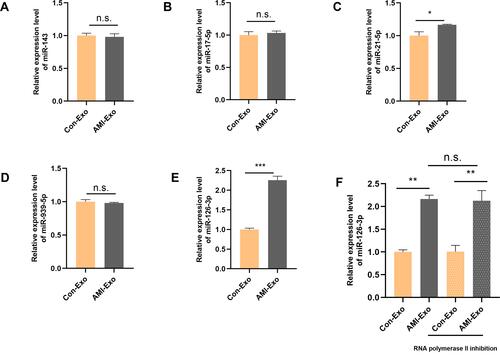
Figure 4 miR-126-3p in AMI-Exo promotes angiogenesis in vitro and ex vivo. Mimic miR-126-3p and inhibitor or control (NC) were transfected into HUVECs containing AMI-Exo or Con-Exo. (A) HUVEC proliferation was measured by manual cell counting, CCK8 absorbance (B), and EdU staining (C and D). Scale bar, 50 μm. (E) Tube formation analysis of vascular formation ability indicated by tube length (F) and node number (G). Scale bar, 100 μm. Cells migration was assessed by scratch wound assays (H) and analyzed as the ratio of non-migrated area divided by the baseline wound area (I). Scale bar, 100 μm. Cell migration was analyzed using Transwell assays (J and K). Scale bar, 50 μm. (L) Microvessels were quantified using aortic sprouting assays (M). Scale bar, 200 μm. **p < 0.01, ***p < 0.001.
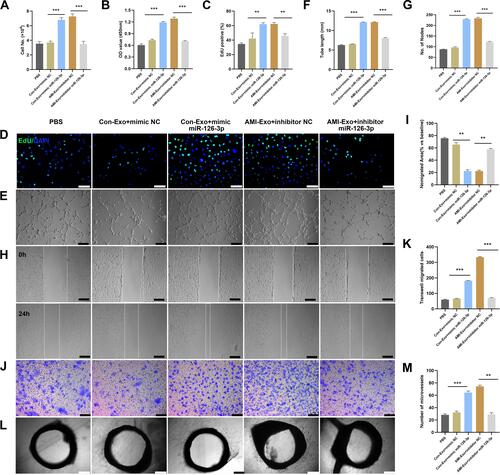
Figure 5 Effect of miR-126-3p in AMI-Exo and Con-Exo on mouse ischemic injury after hind limb ischemia. (A) miR-126-3p expression in ischemic muscles was measured using qRT-PCR after treatment for 24 h (n = 3). (B) Blood flow perfusion was measured using laser Doppler imaging 1, 3, 7, and 14 days after the exosomes were treated with PBS, mimic miR-126-3p, mimic NC, inhibitor miR-126-3p, or inhibitor NC. The left paw was the ischemic and the right paw was normal control (n = 5). (C) The blood perfusion recovery was calculated as the perfusion ratio of the mean velocity in the left rear paw divided by that in the right rear paw. ***Means mimic miR-126-3p vs mimic NC, ###Means inhibitor miR-126-3p vs inhibitor NC (D) The gastrocnemius muscle sections were stained by hematoxylin and eosin. (E) α-SMA and CD31 were identified based on immunofluorescence (red: α-SMA, green: CD31, blue: DAPI). Arrows indicate microvessels. Scale bar, 100 μm. (F) Capillary density in ischemic muscles was measured by the number of microvessels per cm2. **p < 0.01, ***p < 0.001, ###p < 0.001.
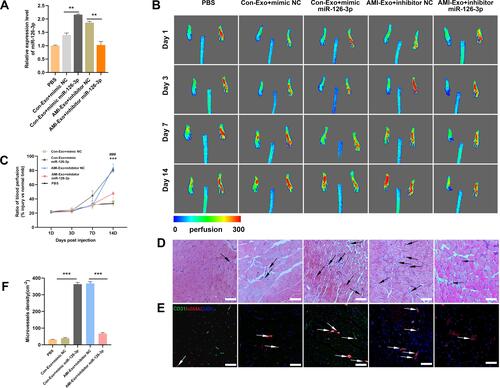
Figure 6 Effect of miR-126-3p in AMI-Exo and Con-Exo on angiogenesis after mouse acute myocardial infarction. (A) miR-126-3p expression in ischemic myocardium was measured using qRT-PCR after treatment for 24 h (n = 3). (B and C) Capillary density in ischemic myocardial was measured by the number of microvessels per mm2. (D and E) The CD31 and α-SMA expression was measured using immunohistochemistry. Scale bar, 200 μm. **p < 0.01, ***p < 0.001.
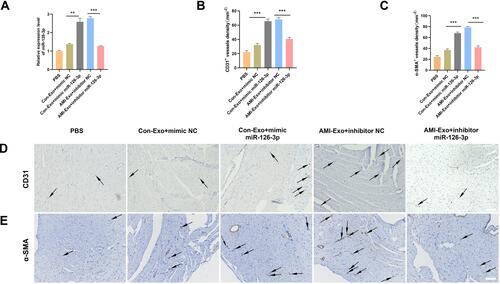
Figure 7 miR-126-3p promotes angiogenesis by directly targeting TSC1. (A) Screening miR-126-3p-targeted genes (B) Relative mRNA expression of TSC1 in HUVECs after treatment with mimic miR-126-3p, mimic NC, inhibitor miR-126-3p, or inhibitor NC. (C) Matched base pairs of the miR-126-3p binding area and reporter plasmids including wild- or mutant-type TSC1. (D) Relative luciferase reporter activity of vectors and a fragment of TSC1 UTR with wild- or mutant-type miR-126-3p binding sites after co-transfection with the four groups. (E) Western blotting showed the relative protein expression of TSC1, pS6, S6, HIF-1α, and VEGFA in HUVECs treated with the mimic miR-126-3p, mimic NC, inhibitor miR-126-3p, or inhibitor NC. (F) Protein expression quantification. (G) Western blotting showed the relative protein expression of TSC1, pS6, S6, HIF-1α, and VEGFA in HUVECs treated with the mimic NC, mimic miR-126-3p, mimic miR-126-3p + oe.NC, mimic miR-126-3p + oe.TSC1. (H) Protein expression quantification. *p < 0.05, **p < 0.01.
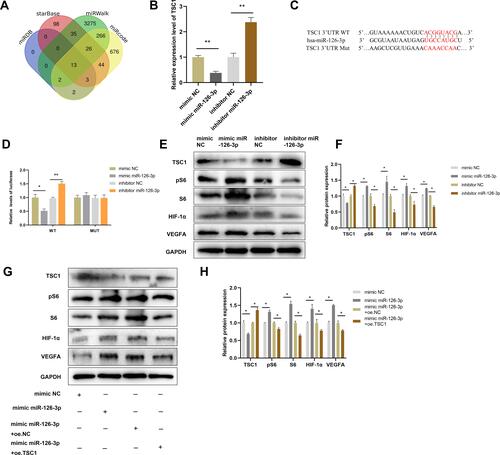
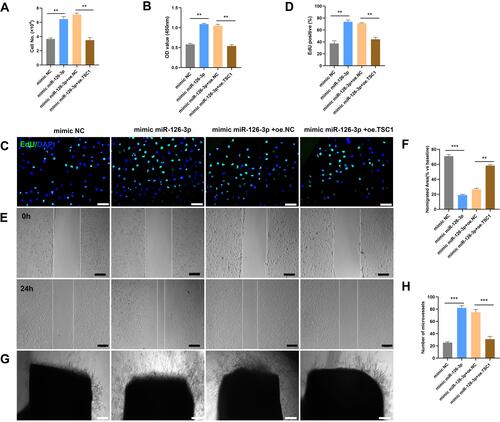
Figure 8 miR-126-3p-targeted TSC1 promotes angiogenesis in vitro. The mimic NC, mimic miR-126-3p, mimic miR-126-3p + oe. NC, and mimic miR-126-3p + oe. TSC1 were transfected into HUVECs. (A) HUVEC proliferation was measured by manual cell counting, CCK8 absorbance (B), and EdU staining (C and D). Scale bar, 50 μm. Cell migration was assessed by scratch wound assays (E) and analyzed as the ratio of non-migrated area divided by the baseline wound area (F). Scale bar, 100 μm. (G) Microvessels were quantified using aortic sprouting assays (H). Scale bar, 200 μm. **p < 0.01, ***p < 0.001.