Figures & data
Figure 1 Schematic diagram of male SD rat experimental design. Ten rats were used in each group and two independent experiments were performed accordingly.
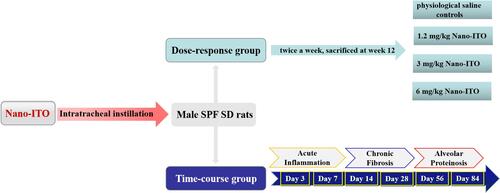
Figure 2 The characterization of the Nano-ITO. (A) The SEM images of the Nano-ITO, and the particles were in nearly spherical structure. Scale bar = 500 nm. (B) Nano-ITO bioaccumulate in lung tissues by TEM analysis. Scale bar = 1 μm.
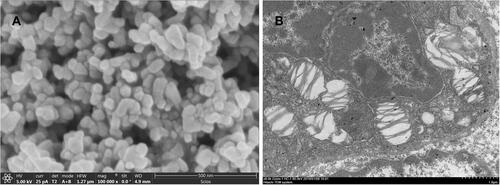
Figure 3 Body weight and organ index in rat. (A) The body weight curve of rat continuously monitored for 12 weeks. (B) The main organ index of rat on Week 12 after exposure to Nano-ITO. *P<0.05 vs control; #P<0.05 vs Nano-ITO 1.2 mg/kg and 3 mg/kg group.
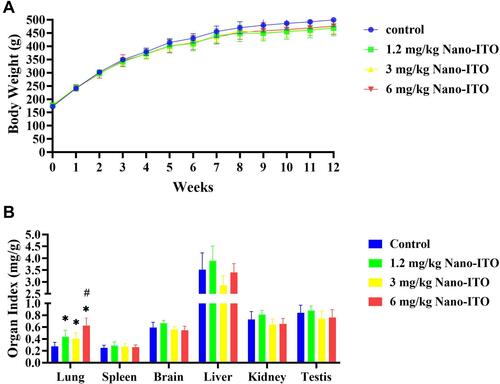
Figure 4 Indium concentration in organs. (A) The indium concentration of six tissues in dose group. The indium concentration of lungs (Ba), spleens (Bb), brains (Bc), livers (Bd), kidneys (Be), and testes (Bf) in time group. *P<0.001 vs control.
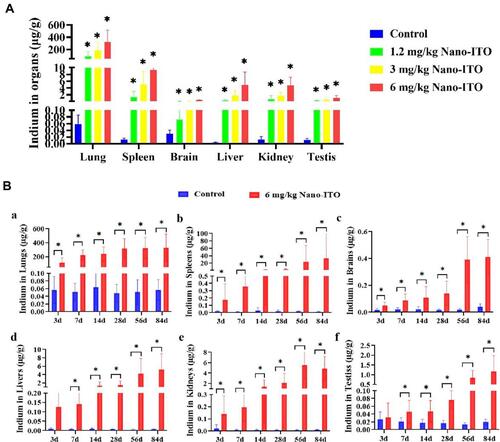
Figure 5 Hematology results of experimental rats. (A) Hematology results in dose group. (B) Hematology results in time group; (a) WBC levels; (b) RBC levels; (c) HGB levels; (d) PLT levels; (e) HCT levels; (f) MCV levels; (g) MCH levels; (h) MCHC levels; (i) RDW-SD levels; (j) RDW-CV levels; (k) PDW levels; (l) MPV levels; (m) PCL levels; (n) P-LCR levels; (o) NEUT levels; (p) LYMPH levels. *P<0.05 vs control.
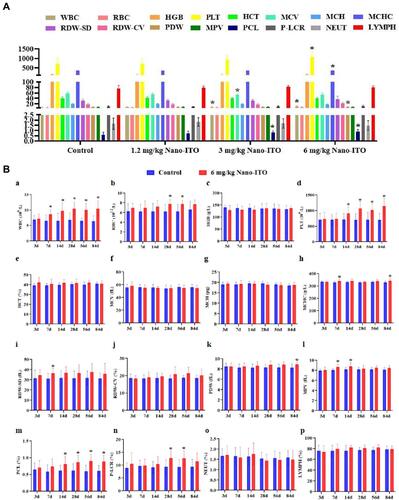
Figure 6 Serum biochemical results of experimental rats. (A) Serum biochemical results in dose group. (B) Serum biochemical results in time group; (a) TP levels; (b) ALB levels; (c) GLB levels; (d) A/G levels; (e) ALT levels; (f) AST levels; (g) CHE levels; (h) TBIL levels; (i) DBIL levels; (j) IBIL levels; (k) BUN levels; (l) UA levels; (m) Cr levels; (n) MDA levels; (o) SOD levels; (p) HYP levels; (q) CAT levels; (r) GSH-px levels. *P<0.05 vs control.
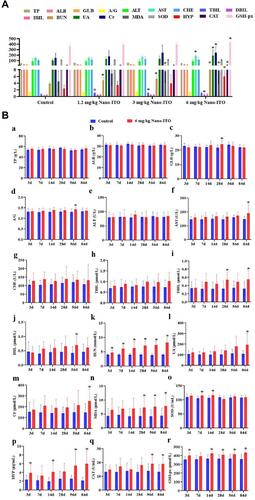
Figure 7 Analysis results of BALF. (A) BALF analysis results in dose group. (B) BALF analysis results in time group; (a) SOD levels; (b) T-AOC levels; (c) MDA levels; (d) TP levels; (e) LDH levels; (f) IL-1β levels; (g) IL-6 levels; (h) IL-10 levels; (i) TNF-α levels. Lung oxidative stress markers (SOD, T-AOC, and MDA); Pulmonary injury markers (TP, LDH); Inflammatory markers in airways (IL-1β, IL-6, IL-10, and TNF-α). *P<0.05 vs control.
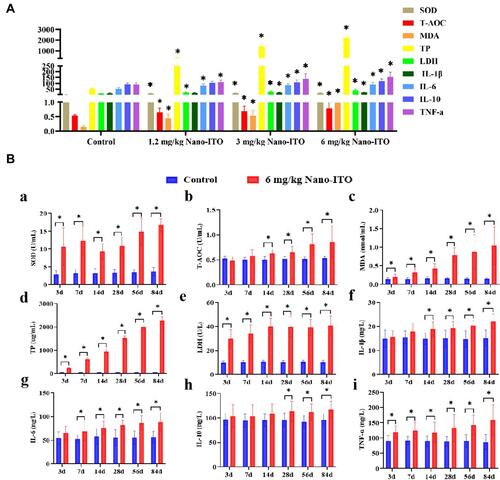
Figure 8 Microscopic findings of the serial lung tissue sections stained with H & E (A), PAS (B), Masson’s trichrome (C), and Sirius red (D) in dose-response study. Scale bar = 1000 μm, 100 μm, and 50 μm (the scale of each figure A–C from left to right); Scale bar in figure D represent 100 μm and 50 μm from left to right.
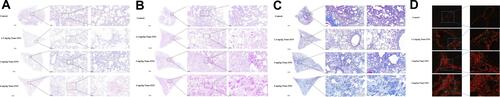
Figure 9 Microscopic findings of the serial lung tissue sections stained with H & E (A), PAS (B), Masson’s trichrome (C), and Sirius red (D) in time-course study. Scale bar = 1000 μm, 100 μm, and 50 μm (the scale of each figure A–C from left to right); Scale bar in figure D represent 100 μm and 50 μm from left to right.
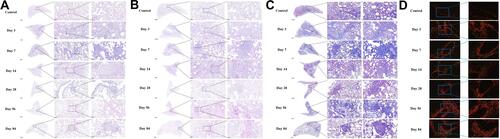
Figure 10 Representative histological images of major organs including spleen, brain, liver, kidney and testis stained with hematoxylin and eosin stain (H & E). Scale bar = 50 μm. Liver: ▲Mild inflammatory cell infiltration, ▲Vacuolation, and ▲Sinusoid dilation. Kidney: ►Vacuolar degeneration in renal tubular epithelial cells, ►Dilated tubules, ►Atrophy of glomeruli, and ♥Cell debris in tubules. Testis: ▼Vacuolization of seminiferous tubules, ⁎Vacuolization of interstitial cells.
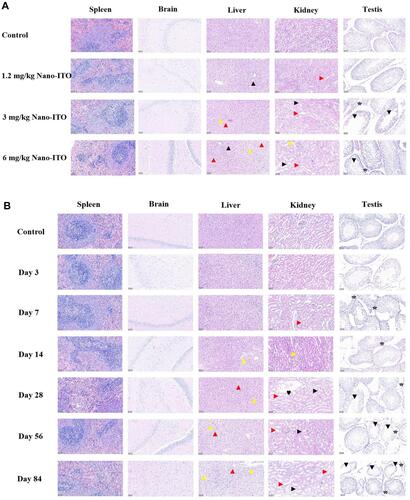
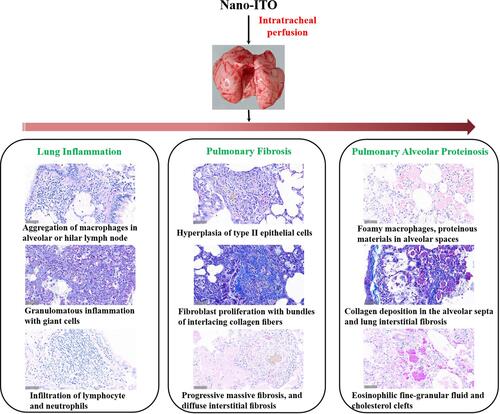
Figure 11 Schematic depiction of the mechanism of Nano-ITO involved in pulmonary inflammation, fibrosis, and PAP events.