Figures & data
Table 1 Components of dialysate solution
Table 2 Nucleotide sequences of human primers for rT-PCR
Figure 1 Screening of special nanobody gene against dectin 1. (A) Polyclonal phage ELISA results. The phages generated from the original library were used as negative controls, and affinity of the panned phages showed a significant increase from the first round to the third round of panning. (B) Monoclonal phage ELISA results of four phages. NC, negative control. (C) Monoclonal phage ELISA results. 1–95, clones selected from the third round of panning; 96, negative control.
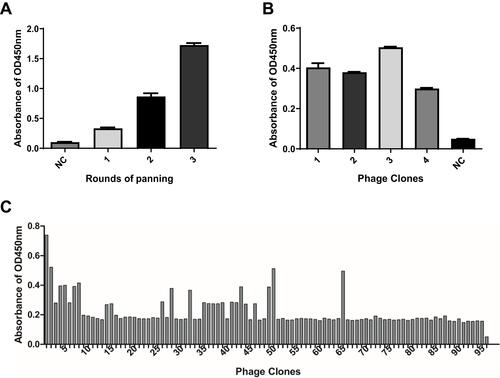
Figure 2 Agarose-gel electrophoresis of the positive clones. M, DNA marker DL2000; lanes 1–4, positive clones; lane 5, negative control.
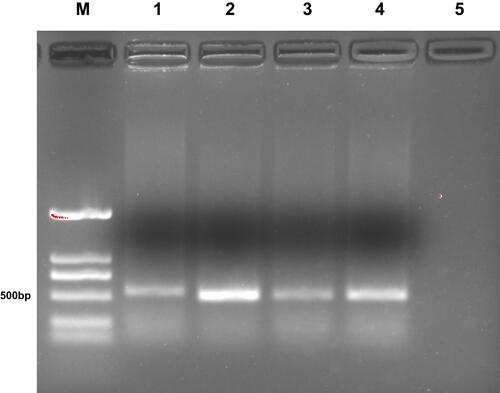
Figure 3 Construction of expression vector of dectin 1–specific nanobodies. (A) The 119 amino–acid sequence of the nanobody. The area marked in red is the CDR3. (B) Nucleic acid electrophoresis of the target gene (M, DNA marker DL2000). Lanes 1–3, target gene. (C) Screening of positive clones on solid plates with kanamycin.
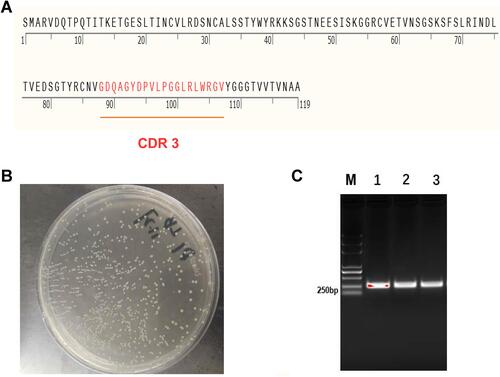
Figure 4 Expression and purification of soluble nanobodies. (A) M, protein marker; 1:, bacterium protein before induction; 2, 16°C supernatant; 3, 16°C precipitation. (B) M, Protein marker; 1, upper sample; 2, effluent; 3–7, 20, 50, 100 mM, 200 mM, 500 mM imidazole-elution component; 8: 16°C precipitation. (C) M:, protein marker; 1–5:, protein after dialysis.
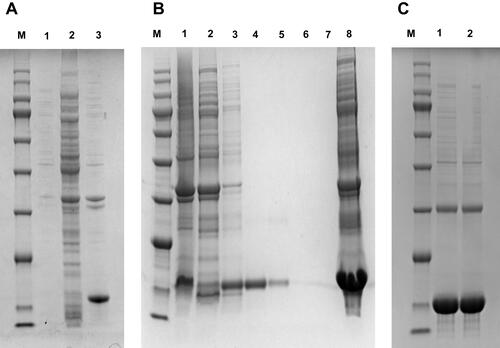
Figure 5 Specificity determination of nanobody specific to dectin 1. Binding activity and specificity of the were analyzed by indirect ELISA. 1–4: 5, 2.5, 1, and 0.5 mg/mL of nanobody. 5, other negative used as negative control; 6, PBS used as blank control.
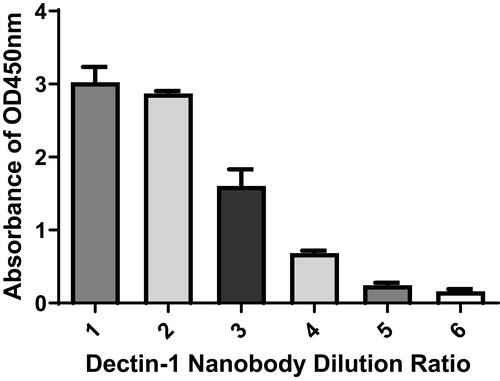
Figure 6 Immunofluorescence analysis of binding activity of nanobody specificies. (A) HCECs with or without A. fumigatus stimulation were incubated with nanobodies and detected with FITC–streptavidin (green fluorescence). Negative nanobodies and PBS were used as negative controls. DAPI was used for nuclear staining (blue fluorescence). (B) RAW 264.7 cells stimulated by A. fumigatus were incubated with nanobodies. Negative nanobodies were used as negative controls.
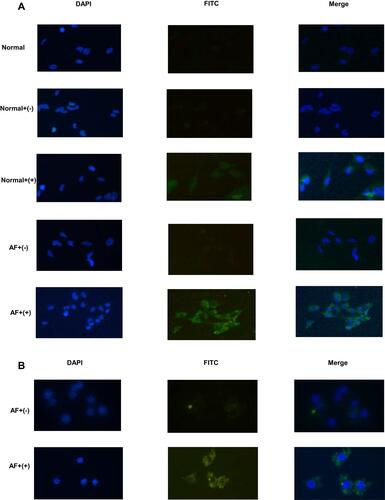
Figure 7 Nanobody treatment inhibited the production of cytokines in HCECs stimulated by A. fumigatus. Compared with PBS treatment, nanobody treatment markedly decreased mRNA expression of IL6 (A) and IL1β (B). ELISA analysis showed that nanobody treatment reduced the protein expression of IL6 (C) and IL1β (D) compared with PBS treatment. Data presented as means ± SD of three independent experiments. pP<0.05 considered statistically significant.
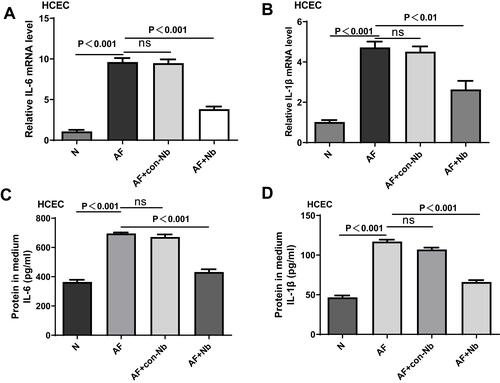
Figure 8 Anti-inflammatory effect of nanobody specific to dectin 1 in mouse A. fumigatus keratitis. (A) Photographs of nanobody- and PBS-treated corneas taken with a slit lamp at 3 and 5 days postinfection. Nanobody treatment relieved the severity of fungal keratitis in mice. Magnification 25×. (B) Significant reductions in clinical scores were observed at 3 and 5 days in nanobody-treated corneas (n=6) compared with PBS-treated corneas (n=6). (C) Immunofluorescence images taken under fluorescence microscopy. The fluorescence in the cornea of the normal group was weak, and the fluorescence in the corneal epithelium was stronger 3 days after infection. Blue, nuclear staining (DAPI); green, dectin 1 staining. Magnification 200×. (D–G) IL1β and IL6 expression in PBS- and nanobody-treatment groups.
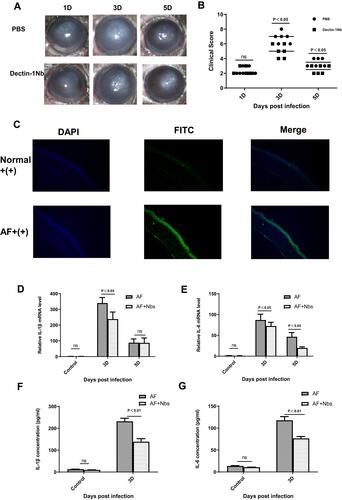
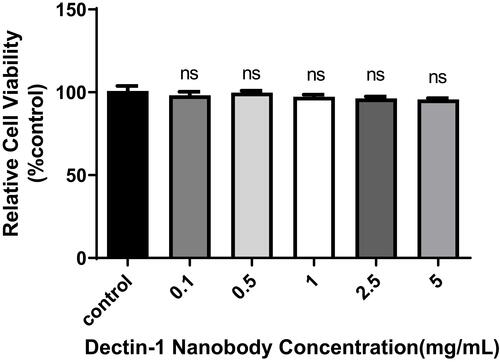
Figure 9 Effects of nanobodies on the proliferation of HCECs. HCECs were seeded onto 96-well cell-culture plates and treated with different concentrations of specific nanobodies of dectin 1 for 24 hours. pP<0.05 considered statistically significant.