Figures & data
Table 1 Surface Elemental Composition of Plasma Nanocoatings as Determined by XPS
Figure 1 XPS spectra of groups A1, A2, B1, and B2.
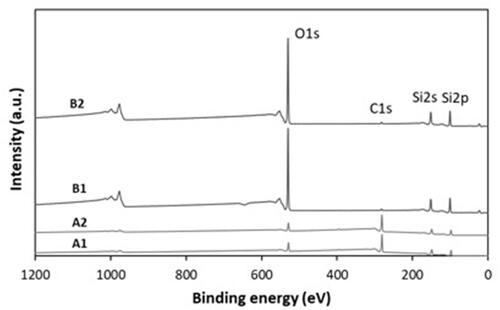
Figure 2 (A) Representative AFM images of nanocoatings. (B) The quantitative analysis of surface roughness of nanocoatings.
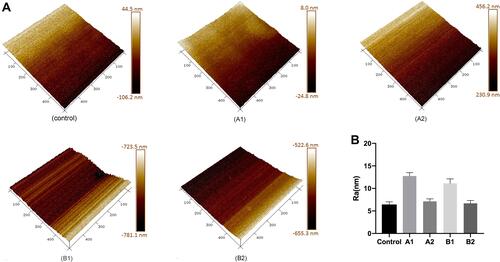
Table 2 Membrane Thickness and Water Contact Angle
Figure 3 The average protein adsorption concentration of nanocoatings. Data are means ± SD; *p < 0.05, **p < 0.01, ***p < 0.001 compared to the control group.
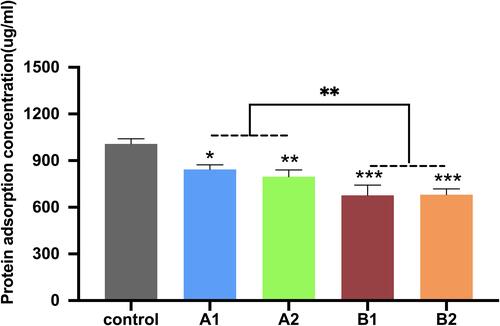
Figure 4 (A) Proliferation of S. aureus after 24 h. (B) Proliferation of S. mutans after 12 and 24 h. (C) S. aureus biofilm formation after 24 h. (D) S. mutans biofilm formation after 12 and 24 h. Data are means ± SD; *p < 0.05, **p < 0.01, ***p < 0.001 compared to the control group; #p < 0.05, ##p < 0.01, ###p < 0.001.
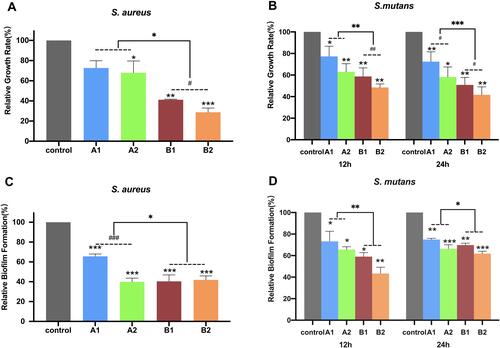
Figure 5 Representative scanning electron micrographs of S. mutans after 12 h of control (A), A1 (B), A2 (C), B1 (D), B2 (E).
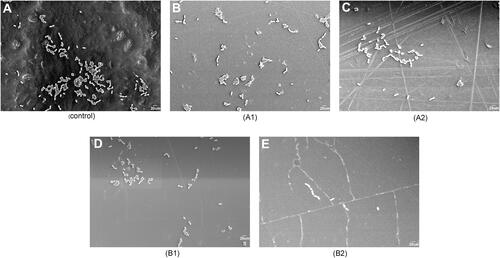
Figure 6 Representative scanning electron micrographs of S. mutans after 24 h control (A), A1 (B), A2 (C), B1 (D), B2 (E).
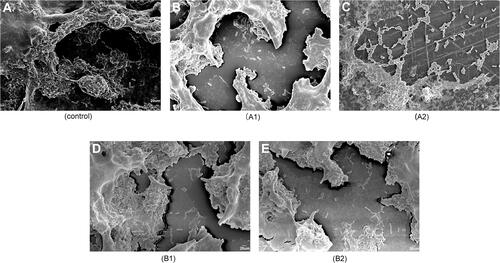
Figure 7 Proliferation of (A) HGFs and (B) HaCaTs after 1, 3, 5 days. Data are means ± SD; *p < 0.05, **p < 0.01, ***p < 0.001 compared to the control group; ##p < 0.01.
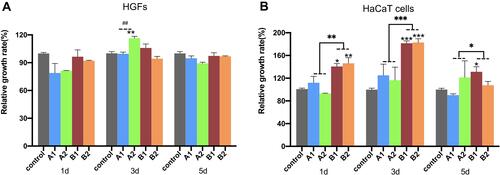
Figure 8 mRNA levels of (A) IL-6, (B) IL-8, (C) COX2, (D) MCP1 in HGFs and HaCaTs (E–H) treated with 10 ng/mL TNF-α for 24 h. Data are relative to the control group + TNF-α. *p < 0.05, **p < 0.01, ***p < 0.001 compared to the control group; #p < 0.05, ##p < 0.01, ###p < 0.001.
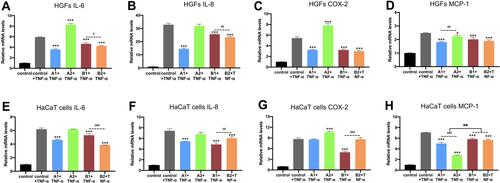
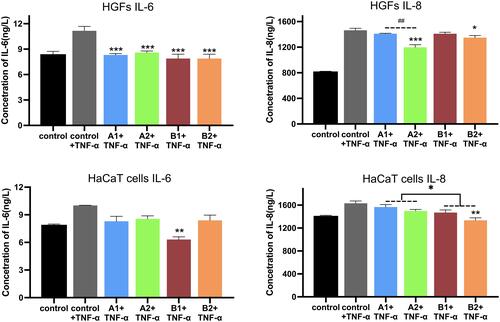
Figure 9 IL-6 and IL-8 levels in supernatant. Data are relative to the control group + TNF-α. *p < 0.05, **p < 0.01, ***p < 0.001 compared to the control group; ##p < 0.01.