Figures & data
Figure 1 Computer-aided design model of the phantom box (A and B) and corresponding pictures of the employed tissue-mimicking phantom (C–E). (A) Global 3-D view of the box; (B) main cross section of the box; (C) phantom top view; (D) phantom lateral view; (E) phantom bottom view.
Note: Main phantom parts are indicated in the figure (see the text for further details).
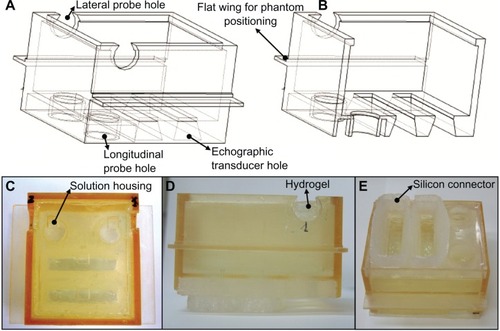
Figure 2 Scheme of the experimental setup adopted for studying the optoacoustic behavior of gold nanorods (GNRs).
Note: Main setup characteristics are indicated in the figure (see the text for further details).
Abbreviation: US, ultrasound.
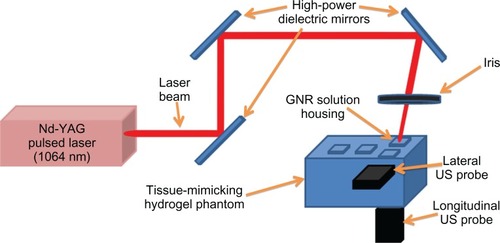
Figure 3 (A and B) Characterization of the polyethylene glycol–coated gold nanorods. (A) Transmission electron microscopy image (scale bar is 100 nm); (B) ultraviolet-visible near-infrared absorption spectrum.
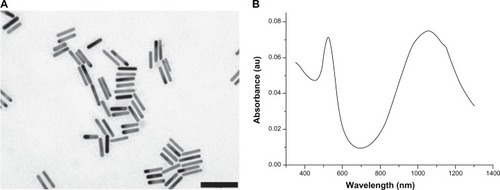
Figure 4 Normalized optical densities of gold nanorods (GNRs) at 1064 nm after exposure to laser fluences of 30, 60, and 90 mJ/cm2 for 20 seconds (black triangles) and 40 seconds (white triangles), and consecutively to the three different laser fluences for 20 seconds each time (white circle).
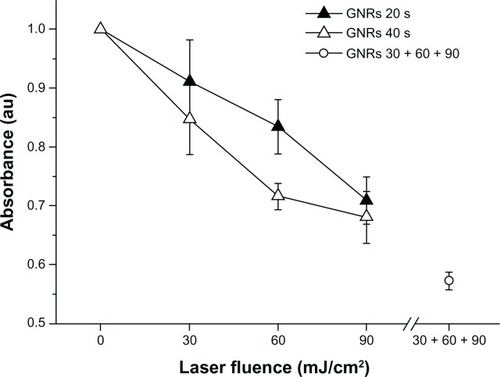
Figure 5 Transmission electron microscopy images of the gold nanorods after different laser exposures: (A) 30 mJ/cm2 for 20 seconds; (B) 60 mJ/cm2 for 40 seconds; (C) 90 mJ/cm2 for 40 seconds; (D) 30, 60, and 90 mJ/cm2 consecutively, for 20 seconds each time.
Note: Scale bars are 200 nm.
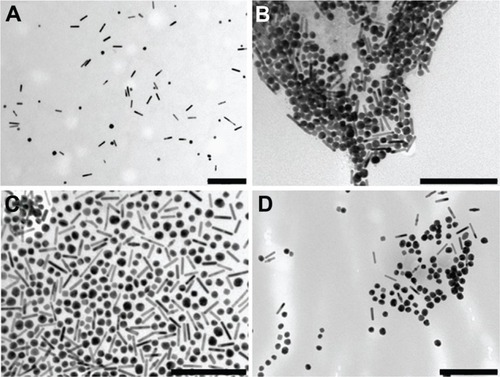
Figure 6 (A and B) Optoacoustic signal amplitude as a function of acquisition direction. (A) Effect of gold nanorod (GNR) concentration (fixed sample volume: 100 μL); (B) effect of GNR sample volume (fixed sample concentration: 100 pM = 6 × 10¹⁰ part/mL).
Notes: The schematic sketches beside each curve represent the solution housing “seen” by the corresponding ultrasound probe in the considered experimental conditions (see Discussion for details). Error bars represent standard deviations.
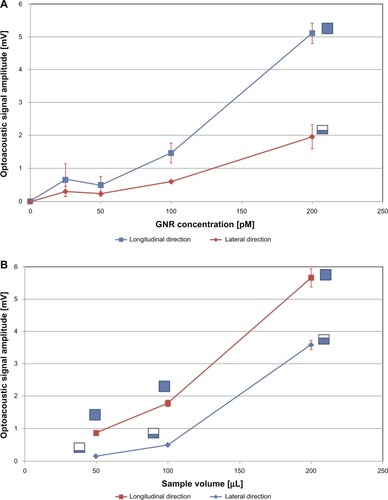
Figure 7 Rate of enhancement (RoE) produced in optoacoustic signal amplitude by each increment in gold nanorod (GNR) concentration with respect to the preceding lower concentration level, for both the considered acquisition directions.
Note: RoE was calculated according to EquationEquation 3(3) (see the text for details).
Notes: Sample volume = 100 μL; error bars represent standard deviations.
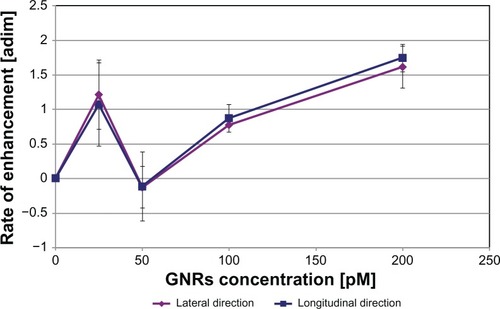
Table 1 Normalized spot intensity as a function of gold nanorod (GNR) concentration (sample volume = 100 μL)
Table 2 Normalized spot intensity as a function of gold nanorod (GNR) sample volume (GNR concentration = 100 pM)
Figure 8 Normalized average spot intensity as a function of lateral distance from the solution housing center for each considered gold nanorod concentration.
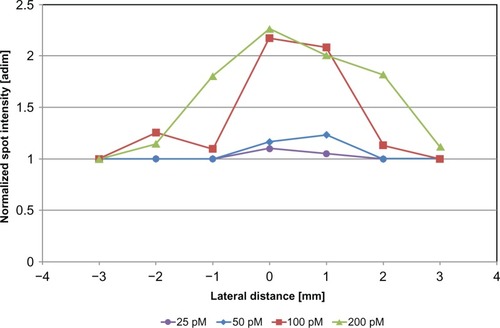
Figure 9 Viability of HeLa cells and MCF-7 cells determined by MTT test after 24 hours’ (A), 48 hours’ (B), and 72 hours’ (C) exposure to gold nanorods (GNRs) in different concentrations (50 pM, 100 pM, and 200 pM).
Notes: The dashed lines indicate a 70% cell viability; error bars represent standard deviations of three independent experiments. *Statistically significant difference with respect to the unexposed control (P < 0.01).
Abbreviation: MTT, (3-[4,5-dimethythiazol-2-yl]-2,5-diphenyl tetrazolium bromide).
![Figure 9 Viability of HeLa cells and MCF-7 cells determined by MTT test after 24 hours’ (A), 48 hours’ (B), and 72 hours’ (C) exposure to gold nanorods (GNRs) in different concentrations (50 pM, 100 pM, and 200 pM).Notes: The dashed lines indicate a 70% cell viability; error bars represent standard deviations of three independent experiments. *Statistically significant difference with respect to the unexposed control (P < 0.01).Abbreviation: MTT, (3-[4,5-dimethythiazol-2-yl]-2,5-diphenyl tetrazolium bromide).](/cms/asset/e2b5bcc7-0fc0-402e-8005-d3a23ede1bb2/dijn_a_33908_f0009_c.jpg)
Table 3 Comparison between the ratio of longitudinal (long) to lateral (lat) exposure factor and the ratio of longitudinal to lateral optoacoustic amplitude as a function of gold nanorod (GNR) sample volume
Figure 10 Optoacoustic signal amplitude measured in the longitudinal direction as a function of gold nanorod (GNR) concentration for differently shaped solution housings.
Notes: Cylindrical solution housings had a base area bigger than the square ones, and for this reason the measured optoacoustic amplitude was higher (uncorrected values). After multiplication for a correction factor taking into account the difference in base area, the trend of the optoacoustic amplitude measured in cylindrical solution housings became very similar to that measured in square housings (corrected values). Sample volume = 100 μL; error bars represent standard deviations.
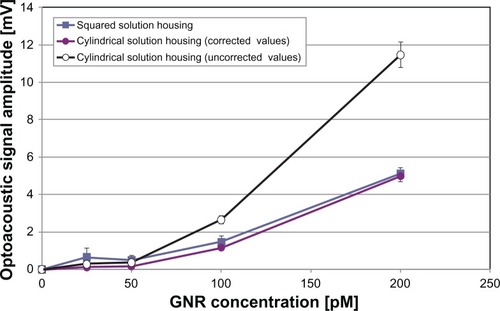
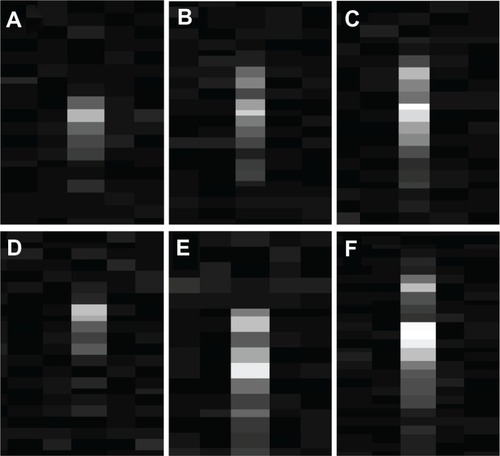
Figure 11 (A–F) Sample echographic images of “optoacoustic spots” detected during laser irradiation at 30 mJ/cm2 of gold nanorod (GNR) solutions of variable volume and concentration. (A) GNR concentration = 25 pM, sample volume = 100 μL; (B) GNR concentration = 50 pM, sample volume = 100 μL; (C) GNR concentration = 200 pM, sample volume = 100 μL; (D) GNR concentration = 100 pM, sample volume = 50 μL; (E) GNR concentration = 100 pM, sample volume = 100 μL; (F) GNR concentration = 100 pM, sample volume = 200 μL.