Figures & data
Figure 1 Chemical structures of amino acid-based cationic lipids used in this study.
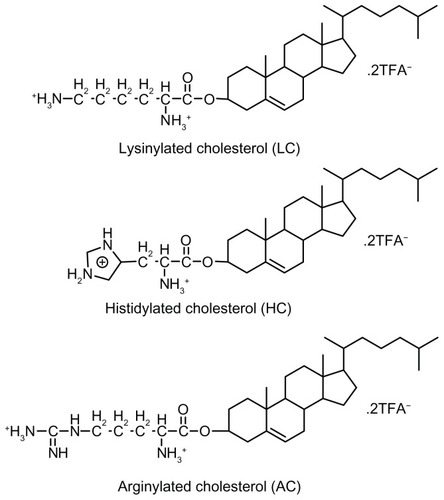
Figure 2 Average particle size (A) and zeta potential (B) of various lipopolyplexes and corresponding polyplexes in the absence of serum.
Note: Data are expressed as the mean ± standard deviation (n = 3).
Abbreviations: LC, lysinylated cholesterol; HC, histidylated cholesterol; AC, arginylated cholesterol; L, lipid; P, polyethylenimine; D, DNA.
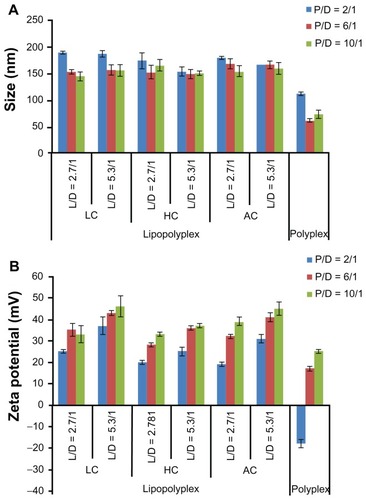
Figure 3 Morphology of lipopolyplexes. Representative images of lipopolyplexes visualized by transmission electron microscopy (A) (black arrows) and atomic force microscopy (B) in the absence of serum.
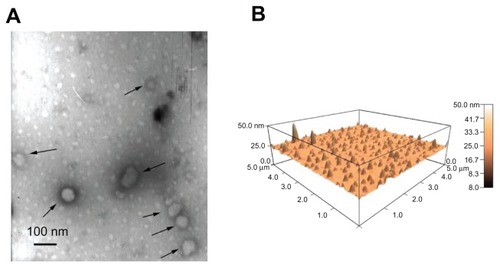
Figure 4 Average particle size (A) and zeta potential (B) of various lipopolyplexes and the corresponding polyplexes after incubation with serum.
Notes: Particle size and zeta potential of the complexes was determined by dynamic light scattering after incubation in 10% fetal bovine serum for 15 minutes. Data are expressed as the mean ± standard deviation (n = 3).
Abbreviations: LC, lysinylated cholesterol; HC, histidylated cholesterol; AC, arginylated cholesterol; L, lipid; P, polyethylenimine; D, DNA.
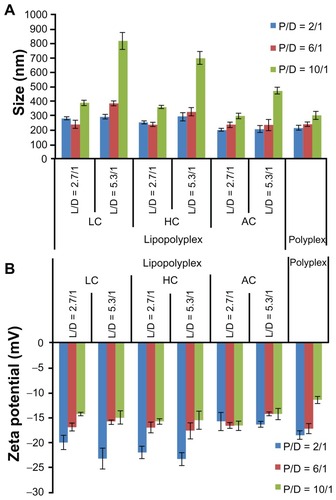
Figure 5 Transfection efficiencies of LC lipopolyplexes (A), HC lipopolyplexes (B), and AC lipopolyplexes (C), and the corresponding lipoplexes and polyplexes in bone marrow stem cells.
Notes: Complexes were prepared at the indicated PEI/DNA and lipid/DNA ratios. Bone marrow stem cells were incubated for 4 hours with complexes in medium containing 10% fetal bovine serum. Forty-eight hours after transfection, the cells were lysed for quantification of luciferase activity. Data are shown as the mean ± standard deviation (n = 3, *P < 0.05 versus polyplex with a PEI/DNA ratio of 10; #P < 0.05 versus HC lipoplex with the lipid/DNA ratio of 2.7).
Abbreviations: LC, lysinylated cholesterol; HC, histidylated cholesterol; AC, arginylated cholesterol; L, lipid; P, polyethylenimine; D, DNA.
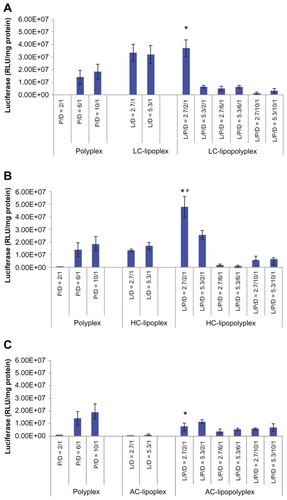
Figure 6 Representative flow cytometry pictures of DNA uptake by bone marrow stem cells.
Notes: Bone marrow stem cells were treated with various complexes in the presence of 10% fetal bovine serum for 4 hours. The percentage of cells containing YOYO-labeled DNA was measured by flow cytometry. Untreated cells were used as the negative control.
Abbreviations: LC, lysinylated cholesterol; HC, histidylated cholesterol; AC, arginylated cholesterol; L, lipid; P, polyethylenimine; D, DNA.
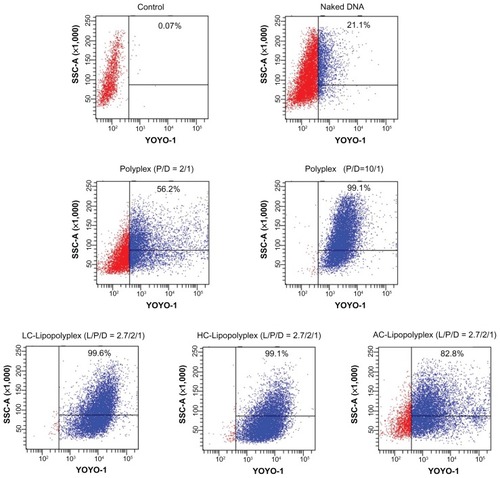
Figure 7 Representative confocal laser scanning microscopy fluorescence images of subcellular localization of various complexes.
Notes: Fluorescein isothiocyanate-labeled PEI is shown in green, rhodamine-labeled lipids are shown in purple, TOTO-labeled DNA is shown in red, and Hoechst-stained nuclei are shown in blue. Bone marrow stem cells were treated for 4 hours with the various complexes formed at the indicated PEI/DNA and lipid/DNA ratios in medium containing 10% fetal bovine serum and observed under confocal laser scanning microscopy (white arrows, free DNA; scale bar 25 μm).
Abbreviations: LC, lysinylated cholesterol; HC, histidylated cholesterol; AC, arginylated cholesterol; L, lipid; P, polyethylenimine; D, DNA.
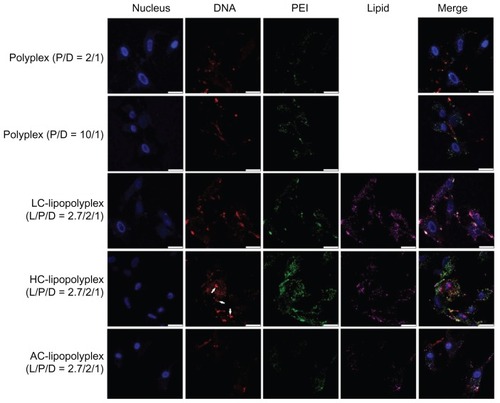
Figure 8 Cytotoxicity of various complexes determined by Cell Counting Kit-8 assay.
Notes: The results show the relative cell viability of bone marrow stem cells exposed for 4 hours to complexes formed at the indicated PEI/DNA and lipid/DNA ratios in the presence of 10% fetal bovine serum. The viability of untreated cells was taken as 100%. Values are represented the mean ± standard deviation (n = 3; *P < 0.05 versus polyplex with a PEI/DNA ratio of 10).
Abbreviations: LC, lysinylated cholesterol; HC, histidylated cholesterol; AC, arginylated cholesterol; L, lipid; P, polyethylenimine; D, DNA.
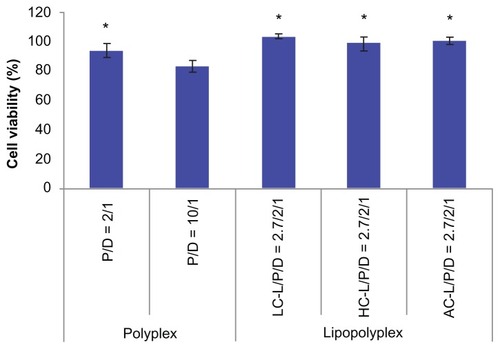
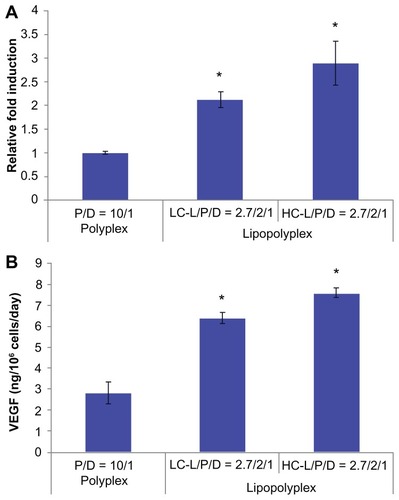
Figure 9 hVEGF165 mRNA (A) and protein (B) expression by transfected bone marrow stem cells.
Notes: Bone marrow stem cells were transfected with complexes prepared at the indicated lipid/DNA and PEI/DNA ratios in the presence of 10% fetal bovine serum. Cells and the culture supernatant were harvested 48 hours after transfection. hVEGF165 mRNA levels in bone marrow stem cells were quantified by real-time polymerase chain reaction. Secretion of vascular endothelial growth factor protein in the culture supernatant was quantified by enzyme-linked immunosorbent assay. Results are normalized for the number of cells and duration of culture, and are expressed as the mean ± standard deviation (n = 3; *P < 0.05 versus the polyplex).
Abbreviations: LC, lysinylated cholesterol; HC, histidylated cholesterol; L, lipid; P, polyethylenimine; D, DNA.
Scheme 1 Schematic illustration depicting formation of lipopolyplexes by combining preformed polyplex core with cationic lipids.
Abbreviation: PEI, polyethylenimine.
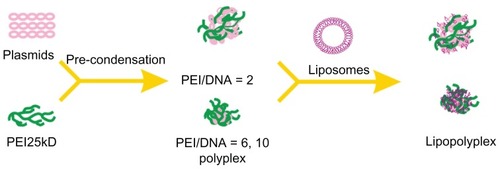
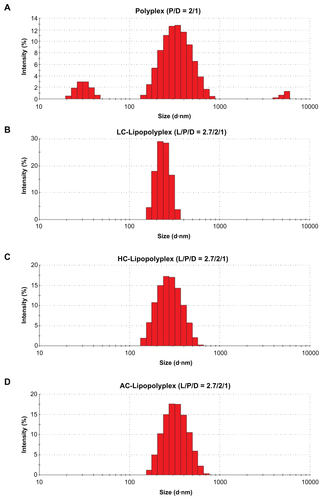
Figure S1 Representative particle size distributions of various complexes after incubation with serum.
Note: Particle size distributions of the complexes were determined by dynamic light scattering after incubation in 10% fetal bovine serum for 15 minutes.
Abbreviations: LC, lysinylated cholesterol; HC, histidylated cholesterol; AC, arginylated cholesterol; L, lipid; P, polyethylenimine; D, DNA.