Figures & data
Figure 1 Synthesis of Lac-DOPE.
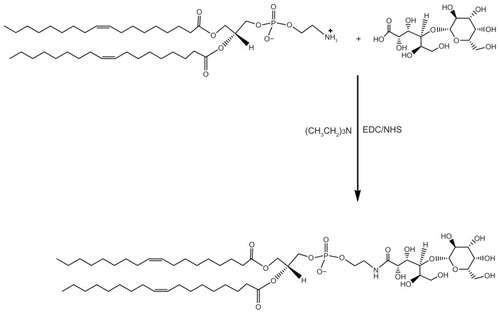
Figure 2 Cellular uptake of liposomes in HepG2 cells.
Notes: Cells were incubated with L-calcein, Lac-L-calcein, and Lac-L-calcein plus 20 mM lactose as a blocking agent for one hour before being subjected to analysis. The fluorescence intensity in HepG2 cells treated with Lac-L-calcein was significantly higher than that of nontargeted liposomes. Meanwhile, the fluorescence of Lac-L-calcein in HepG2 cells was decreased by treatment of 20 mM lactose as an asialoglycoprotein receptor blocking agent.
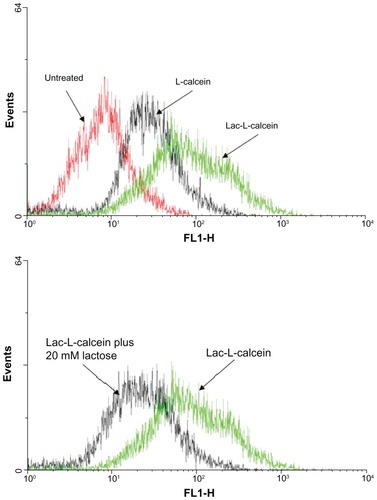
Figure 3 Cellular uptake of Lac-L-calcein in HepG2 cells detected by confocal microscopy. Cells were incubated with phosphate-buffered saline, L-calcein, Lac-L-calcein, and Lac-L-calcein plus 20 mM lactose at the same concentrations of calcein for one hour. (A) Cells treated with L-calcein. (B) Cells treated with Lac-L-calcein. (C) Cells treated with Lac-L-calcein plus 20 mM lactose.
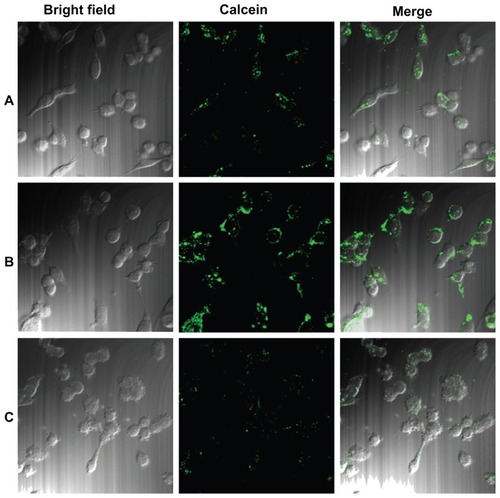
Table 1 Cytotoxicity of L-DOX formulations to HepG2 cells
Table 2 Pharmacokinetic parameters in different formulations after intravenous injection at a doxorubicin dose of 5 mg/kg body weight (n = 3)
Figure 4 Plasma concentrations of DOX in different formulations.
Notes: DOX in different formulations (5 mg/kg) was injected via the tail veins of normal mice. Data are expressed as the mean ± standard deviation (n = 3). (●) Free DOX, (○) L-DOX, (▲) Lac-L-DOX.
Abbreviations: DOX, doxorubicin; L-DOX, liposomal doxorubicin; Lac-L-DOX, lactosylated liposomes encapsulating doxorubicin.
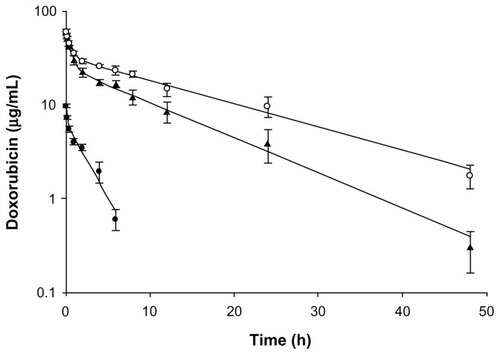
Figure 5 Tissue distribution of DOX in different formulations at 4 hours after intravenous injection in female tumor-bearing nude mice.
Notes: Data are expressed as the mean ± standard deviation (n = 5). ***P < 0.005, significant difference compared with free DOX; **P < 0.005, significant difference compared with L-DOX; *P < 0.05, significant difference compared with L-DOX.
Abbreviations: DOX, doxorubicin; L-DOX, liposomal doxorubicin; Lac-L-DOX, lactosylated liposomes encapsulating doxorubicin.
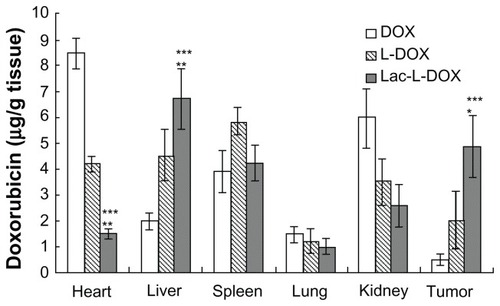
Figure 6 Confocal micrographs of tissue from female tumor-bearing nude mice injected with different formulations of DOX, 4 hours prior to euthanasia. The tissue section was labeled for cytoskeletal filamentous actin with Alexa Fluor 488® conjugated with phalloidin. (A) Lac-L-DOX in liver, (B) L-DOX in liver, (C) free DOX in liver, (D) Lac-L-DOX in tumor, (E) L-DOX in tumor, and (F) free DOX in tumor.
Note: The white arrows denote Kupffer cells.
Abbreviations: DOX, doxorubicin; L-DOX, liposomal doxorubicin; Lac-L-DOX, lactosylated liposomes encapsulating doxorubicin.
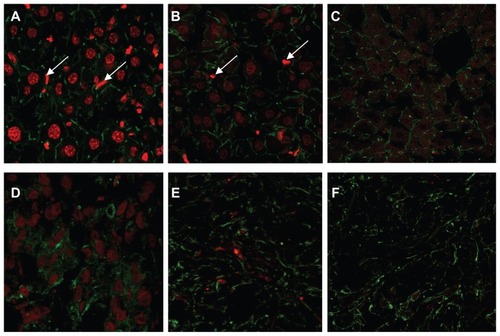
Figure 7 Tumor growth inhibition after intravenous injection of free DOX, L-DOX, or Lac-L-DOX in tumor-bearing mice at a DOX dose of 5 mg/kg body weight.
Notes: Data are shown as the mean ± standard deviation (n = 10). ***P < 0.05, statistically significant compared with phosphate-buffered saline control; **P < 0.05, statistically significant compared with free DOX; *P < 0.05, statistically significant compared with L-DOX.
Abbreviations: DOX, doxorubicin; L-DOX, liposomal doxorubicin; Lac-L-DOX, lactosylated liposomes encapsulating doxorubicin; PBS, phosphate-buffered solution.
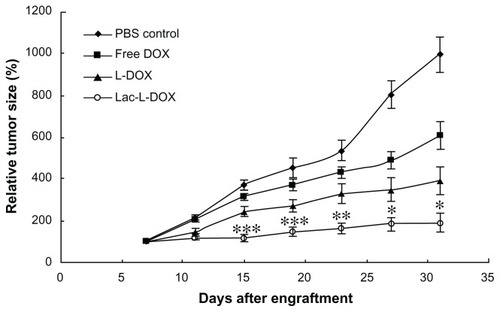
Table 3 Survival of mice after treatment with free DOX, L-DOX, and Lac-L-DOX in HepG2 tumor-bearing miceTable Footnotea
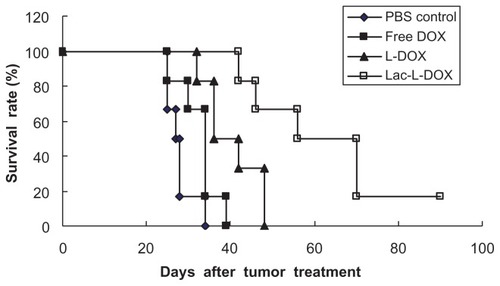
Figure 8 Kaplan–Meier survival curve of mice bearing HepG2 xenografts.
Notes: Animals (10 per group) were treated with 5 mg/kg of free DOX, L-DOX or Lac-L-DOX. The treatment was continued every 4 days for four times.
Abbreviations: DOX, doxorubicin; L-DOX, liposomal doxorubicin; Lac-L-DOX, lactosylated liposomes encapsulating doxorubicin; PBS, phosphate-buffered solution.