Figures & data
Table 1 Various Characterizations of the E-SLNs
Figure 1 (A) Transmission electron microphotograph of E-SLNs. Bar = 100 nm. (B) Particle size distribution of E-SLNs.
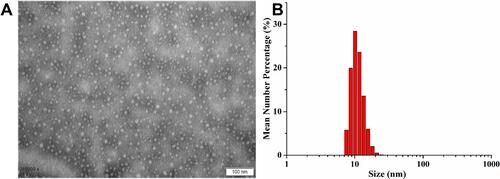
Figure 2 In vitro release profiles of E-SLNs (pH 7.4 artificial tear solution was used as the dialysis medium, n = 3, mean ± SD).
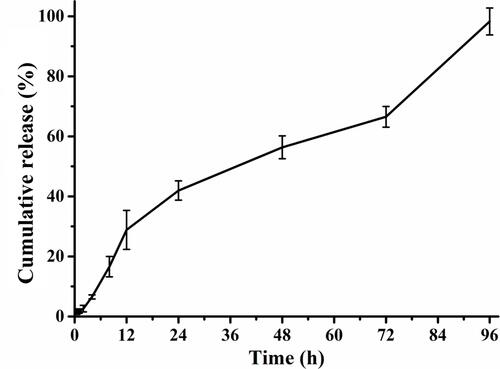
Table 2 Mathematical Models of Regression for the in vitro Release Profiles of E-SLNs
Figure 3 DSC thermograms of tripalmitin (TM), econazole (ECZ), E-SLNs and a physical mixture of ECZ and TM.
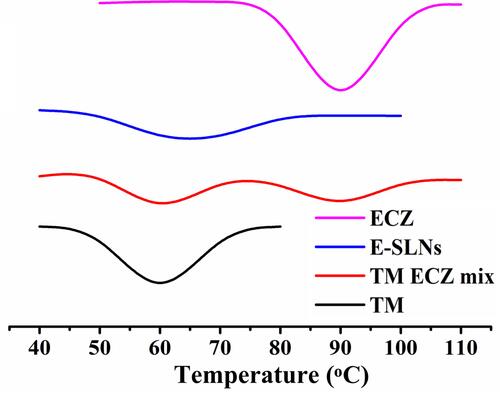
Table 3 Corneal Permeation Parameters of the ECZ from E-SLNs and E-Susp and the Hydration Rates
Table 4 Comparative Study of the Antifungal Activity of E-SLNs and E-Susp Against A.Fusarium
Figure 4 Microbiological studies against A.Fusarium by the agar diffusion method for 48 h.
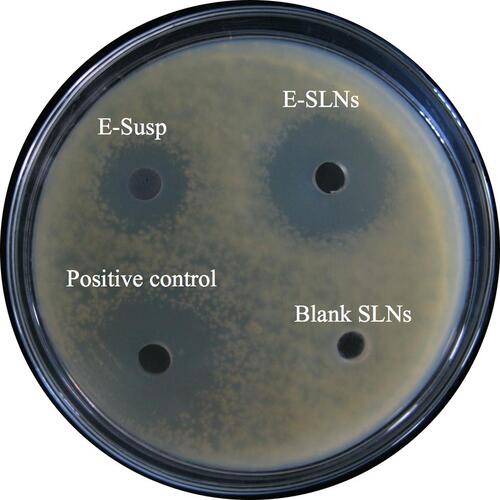
Figure 5 Representative images of the in vivo rabbit ocular irritation test. (A) E-SLNs, (B) Saline.
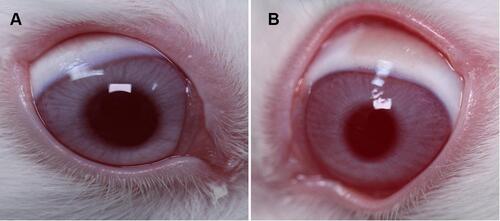
Table 5 Ocular Pharmacokinetic Parameters of E-SLNs and E-Susp in the Tear Liquid and Cornea After the Administration of Different Formulations
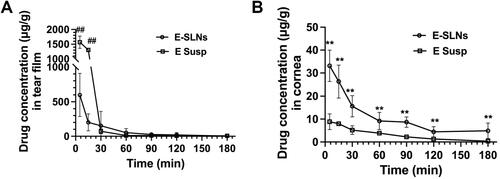
Figure 6 Pharmacokinetics studies in rabbit eyes after a single administration of either formulation. The ECZ concentration-time profiles in the (A) Tear film and (B) Corneas of rabbits. The drugs were E-SLNs and E-Susp at a single dose of 50 μL. Values are given as the mean ± SD (n=6). **Significantly different (p < 0.01) from the E-Susp group. ##Significantly different (p < 0.01) from the E-SLN group.