Figures & data
Table 1 Initial suspension composition (before spray-drying), theoretical composition of the spray-dried formulation, and ITZ experimental content as determined by HPLC
Table 2 Laser diffraction diameters (Malvern Mastersizer 2000 Hydro) of suspension S6 during the different stages of the size-reduction process and of the spray-dried formulations C, N1, N2, N3, and N4 after reconstitution in aqueous media
Table 3 Physical properties of all formulations tested: particle-size characteristics (means ± standard deviation, n = 3), as measured with the Mastersizer 2000 Sirocco; bulk density, tapped density, and calculated Carr’s index; aerodynamic features (FPF as a % and MMAD in μm) as determined by MsLI tests (flow rate, 100 L/minute); and saturation-solubility value (ng/mL), determined in physiological phosphate buffer solution (pH 7.2)
Figure 1 Scanning electron microscope micrographs of raw itraconazole (ITZ) and the spray-dried formulations at magnifications of 5000× and 10,000×.
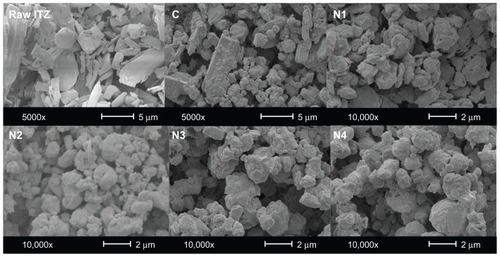
Figure 2 Powder X-ray diffractograms of raw itraconazole (ITZ), formulations C, N1, N2, N3, and N4, and excipients tocopherol polyethylene 1000 succinate (TPGS), sodium taurocholate (NaTau), and spray-dried (SD) mannitol.
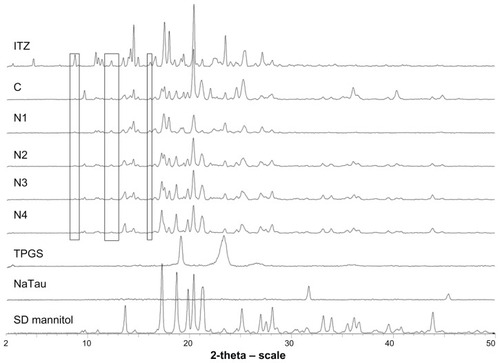
Figure 3 Graphical representation of formulations’ itraconazole (ITZ) content (expressed as a % of the mean experimental total ITZ content) for each aerodynamic particle-size fraction.
Note: Powders were fractionated in a next-generation impactor at 60 L/minute.
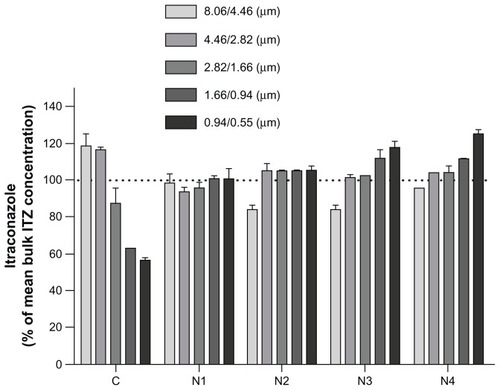
Figure 4 Graphical representation of the in vitro pulmonary deposition patterns of the C, N1, N2, N3, and N4 formulations (MsLI, 100 L/minutes, 2.4 seconds, n = 3).
Note: Itraconazole (ITZ) doses were recovered from the device, the throat, and stages 1–5 of the multistage liquid impactor deposition and are expressed as a % of the nominal dose (2.5 mg).
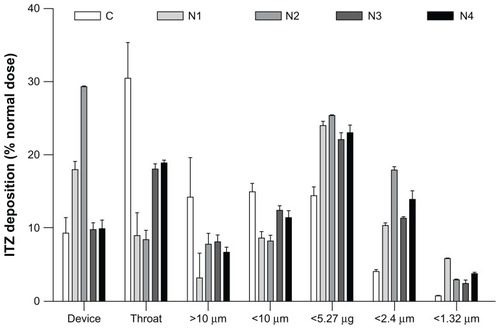
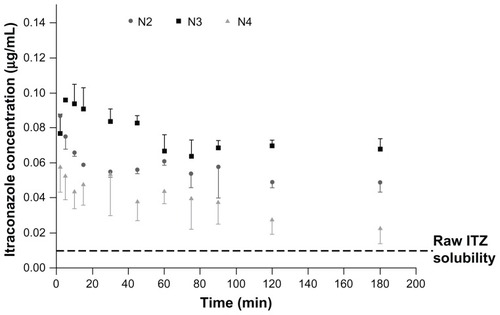
Figure 5 Supersaturation solubility of formulations N2, N3, and N4 in physiological phosphate buffer (pH 7.2) containing 0.02% dipalmitoylphosphatidylcholine.
Abbreviation: ITZ, itraconazole.