Figures & data
Figure 1 The preparation and siRNA delivery of CHCE/siRNA NPs. (A) Synthesis of CHCE/siRNA nanoparticle. Nanocarrier backbone carboxymethyl chitosan (red), cholesterol (blue), and helper histidine (Green). The CHCE forms stable NPs through self-assembly. (B) The CHCE/siRNA NPs target delivery to the tumor. (C) The endosomal escape and RNAi-induced gene silencing.
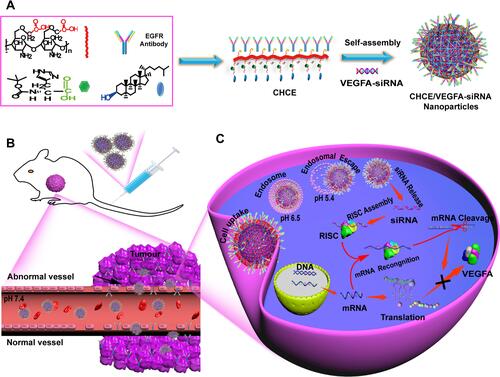
Figure 2 Preparation and characterization of CHCE/siRNA NPs. (A) Synthesis of CHCE/siRNA nanoparticle. (B) The relationship between the intensity ratio (I372/I385) from excitation spectra of pyrene and the logarithm of the concentration of CHCE. (C) SEM image of CHCE/siRNA NPs in distilled water. (D) The size distribution of CHCE/siRNA NPs in SEM image. (E) The zeta potential distribution of CHCE/siRNA NPs in PBS buffers with different pH. (F) The size distribution of CHCE/siRNA NPs in PBS buffers with different pH. (G) The stability of CHCE/siRNA NPs in 50% serum at 37°C was detected by the electrophoresis gel. The dissociated siRNA is positioned against the mark band and the pure siRNA band.
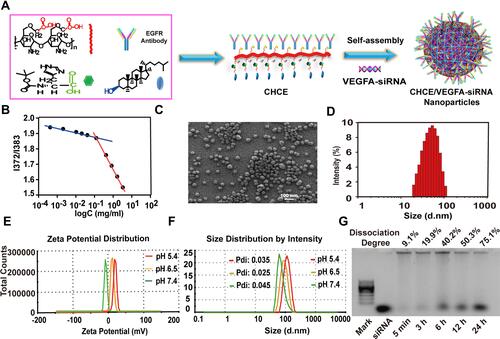
Figure 3 EGFR-mediated CHCE/siRNA specific binding to tumor cells. (A) Flow cytometry detected the binding efficiency of CHCE/siRNA. (B) The binding efficiency of CHCE/siRNA. *P<0.05 (two-tailed t-test). NS: no significant difference. (C) Flow cytometry and (D) Laser scanning confocal microscope detected the inhibitory effect of panitumumab on the binding between CHCE/siRNA NPs and SK-MEL-28 cells. Scale bar, 10 µm.
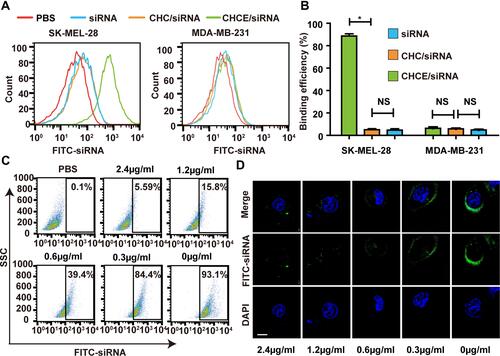
Figure 4 The cellular uptake and endosomal escape of CHCE/siRNA NPs. (A) Flow cytometry and (B) Laser scanning confocal microscope detected the cellular uptake efficiency of CHCE/siRNA NPs. Scale bar, 10 µm. (C) A laser scanning confocal microscope detected the endosomal escape of CHCE/siRNA NPs. (the siRNA were modified with FITC, the endosomes were labeled with LysoTracker). Scale bar, 10 µm. (D) The corresponding colocalization fluorescence intensity profiles of siRNA (green) and endosomes (red) in SK-MEL-28 cells after CHCE/siRNA NPs treatment for different times. (E) The corresponding colocalization ratios of siRNA (green) and endosomes (red).
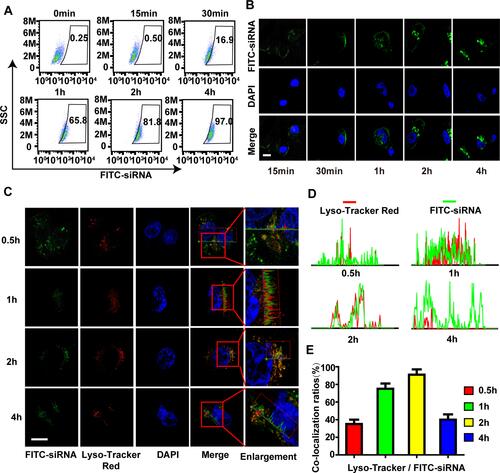
Figure 5 The gene silence of CHCE/siRNA NPs in vitro. The PBS was the blank control group, the CHCE/nc-siRNA was the negative control group, and the PEI/siRNA was the positive control group. (A) The qPCR detected the VEGFA mRNA expression in tumor cells. (mean ± sem, n = 3). *p < 0.05 (two-tailed t-test). (B) Western blot detected the VEGFA protein expression. GAPDH was used as a reference protein. The band intensity of VEGFA and GAPDH expression was measured with ImageJ. The relative ratio was calculated with the intensity of VEGFA divided by the intensity of GAPDH in the same treatment group. (C) The cell viability of CHCE/siRNA NPs was detected by MTS (mean ± sem, n = 3). * p <0.05, (two-tailed t-test). NS: no significant difference. (D) Cell apoptosis was detected by Annexin V and PI staining. The lower left, lower right, upper right, and upper left quadrants represent cell survival, early apoptosis, late apoptosis, and necrosis.
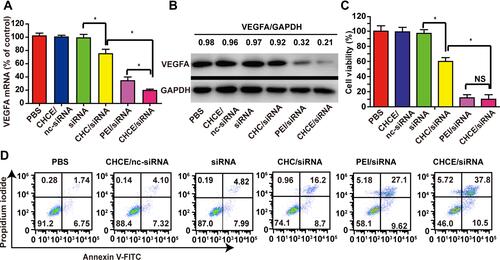
Figure 6 Biodistribution of CHCE/siRNA in vivo. (A) Whole-body NIR fluorescence imaging of mice bearing tumors. (B) Pharmacokinetic studies were performed by measuring the blood siRNA concentration in vivo. (mean ± sem, n = 3). *p < 0.05 (two-tailed t-test). (C) Ex vivo imaging of tumors and other major organs. (D) Quantitative analysis of CHCE/siRNA in tumors and other major organs by the ex vivo fluorescence signals. *P < 0.05 (two-tailed t-test). (E) The tumor penetration of CHCE/siRNA. Green, FITC-labelled siRNA. Scale bar, 50 µm. (F) The green fluorescent signal intensity of CHCE/siRNA. *p < 0.05 (two-tailed t-test).
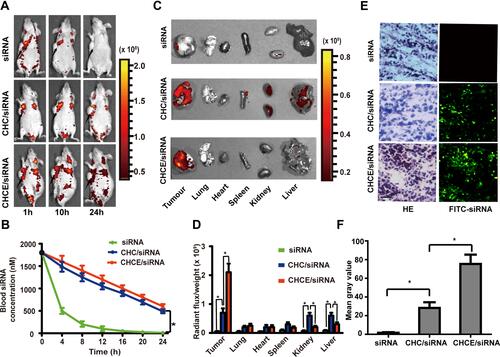
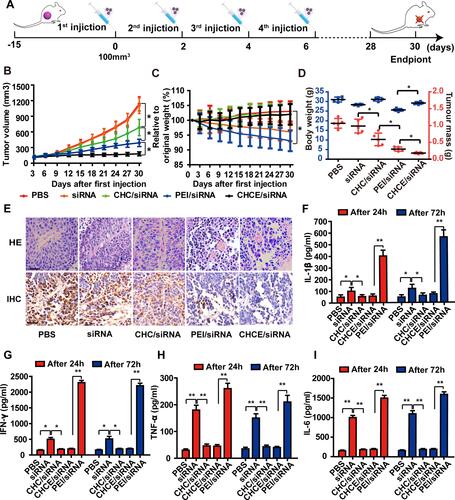
Figure 7 The antitumor effect of CHCE/siRNA NPs in vivo. (A) The treatment schemes. (B) The growth curves of tumors with various siRNA agents. The PEI/siRNA was the positive control group. (mean ± s.e.m., n=5). *p < 0.05, (two-tailed t-test). (C) The change in body weight after treatments (mean ± s.e.m., n=5). *p < 0.05, (two-tailed t-test). (D) The tumor volume and the tumor weight at the end of treatment. (mean ± s.e.m., n=5). *p < 0.05, (two-tailed t-test). (E) H&E and IHC showing antitumor effect. Scale bar, 50 µm. (F–I) Potential immune responses after treatments were detected by ELISA (data represent mean ± s.e.m., n = 3), *p < 0.05, **p < 0.01 (two-tailed t-test).