Figures & data
Table 1 Characterization of polymer NCs
Table 2 % degradation of IgG and IgG NCs in vitro
Figure 1 Biodistribution and degradation of IgG in the GI tract. Mice were orally gavaged with 125I-IgG in either PBS or NaHCO3. One hour later, the indicated sections of the GI were harvested and measured for their 125I-content, expressed as % ID (A). Alternatively, samples were subjected to TCA precipitation to determine the percentage of free 125Iodine, reflective of antibody degradation (B).
Notes: Data are mean ± SEM (n ≥ 3). *P < 0.05 between saline and NaHCO3 groups.
Abbreviations: PBS, phosphate-buffered saline; GI, gastrointestinal; TCA, trichloroacetic acid; % ID, percentage of the total injected dose; SEM, standard error of the mean.
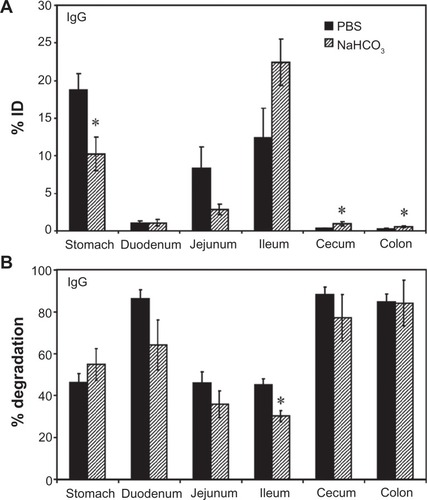
Figure 2 In vitro degradation of IgG under GI-mimicking conditions. 125I-IgG was incubated for the indicated time periods in SGF with or without pepsin, or SIF with or without pancreatin, and the percentage of 125I-IgG degradation was calculated as described in . Curves were fitted by software regression analysis.
Note: Data are mean ± SEM (n ≥ 3 per experiment and at least two independent experiments).
Abbreviations: SGF, simulated gastric fluid; SIF, simulated intestinal fluid; SEM, standard error of the mean.
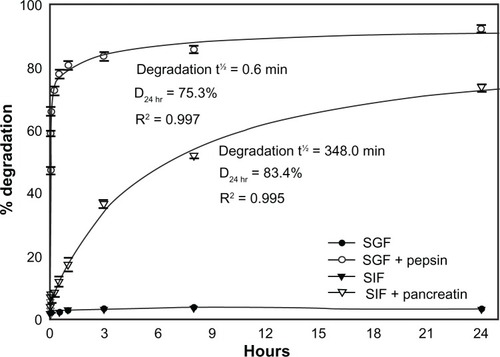
Figure 3 Biodistribution and degradation of IgG nanocarriers in the GI tract. Mice were gavaged with 125I-IgG-coated model polymer NCs (IgG NCs) in PBS, final diameter 269.8 ± 6.3 nm, and compared to their 125I-IgG counterparts. One hour later, the indicated sections of the GI tract were harvested and measured for their 125I-content, expressed as % ID (A). Samples were also subjected to TCA precipitation to determine the percentage of free 125Iodine, reflective of degradation (B).
Notes: Data are mean ± SEM (n ≥ 3). *P < 0.05 between IgG and IgG NC groups.
Abbreviations: GI, gastrointestinal; NC, nanocarrier; PBS, phosphate-buffered saline; % ID, percentage of the total injected dose; TCA, trichloroacetic acid; SEM, standard error of the mean.
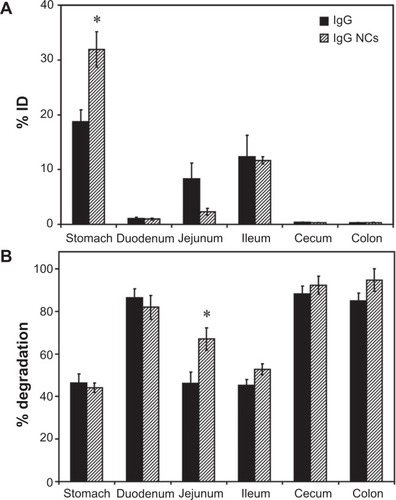
Figure 4 In vitro degradation of IgG nanocarriers under GI-mimicking conditions. 125I-IgG NCs were incubated for the indicated time periods in SGF ± pepsin or SIF ± pancreatin, followed by TCA precipitation to determine the percentage of free 125Iodine, reflective of degradation, as described in . Curves were fitted by software regression analysis.
Note: Data are mean ± SEM (n ≥ 3 per experiment and at least two independent experiments).
Abbreviations: GI, gastrointestinal; NC, nanocarrier; SGF, simulated gastric fluid; SIF, simulated intestinal fluid; TCA, trichloroacetic acid; SEM, standard error of the mean.
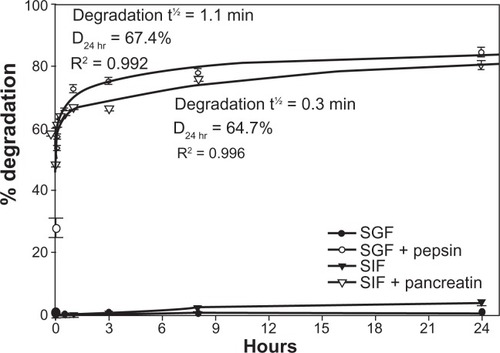
Figure 5 Biodistribution of anti-ICAM and anti-ICAM nanocarriers in the GI tract. Mice were gavaged with PBS containing 125I-anti-ICAM vs 125I-IgG (A) or 125I-anti-ICAM NCs vs 125I-IgG NCs (B), and 125Iodine biodistribution in the stomach, duodenum, and distal GI regions (encompassing jejunum, ileum, cecum, and colon) was assessed one hour later as described in . A comparison of the biodistribution of 125I-anti-ICAM vs 125I-anti-ICAM NCs is shown in (C).
Notes: Results are expressed as % ID. Data are mean ± SEM, (n ≥ 3). (A) and (B) *P < 0.05; **P < 0.005 between nontargeting IgG and ICAM-targeting groups. (C) *P < 0.05 between anti-ICAM free antibody and anti-ICAM NCs.
Abbreviations: ICAM, intercellular adhesion molecule; GI, gastrointestinal; PBS, phosphate-buffered saline; NC, nanocarrier; % ID, percentage of the total injected dose; SEM, standard error of the mean.
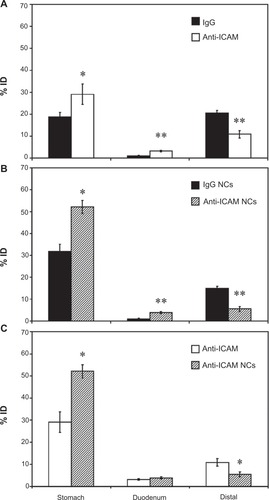
Figure 6 Visualization of anti-ICAM nanocarriers bound to GI tissue. Mice were gavaged with FITC-labeled anti-ICAM NCs in PBS, then euthanized after 15 minutes. Cross-sectional dissections were made in the stomach, duodenum, jejunum, and ileum.
Notes: Dissected tissue was thoroughly rinsed to remove unbound NCs and imaged by microscopy to detect tissue-associated fluorescent NCs. Scale bar = 500 μm.
Abbreviations: ICAM, intercellular adhesion molecule; GI, gastrointestinal; NC, nanocarrier; PBS, phosphate-buffered saline.
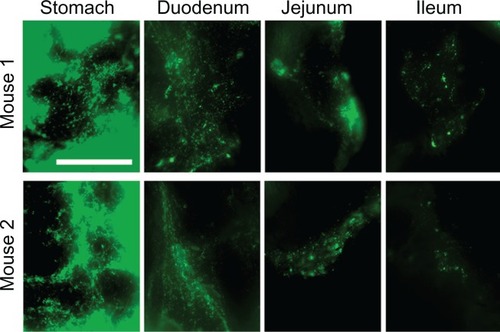
Figure 7 Visualization of epithelial endocytosis of anti-ICAM nanocarriers into GI tissue. Mice were gavaged with saline (A–C) or anti-ICAM-coated iron oxide nanoparticles suspended in NaHCO3 (D–I).
Notes: GI tissue was isolated after 10 minutes, processed, and imaged by TEM and iron EDS. In each row, a lower-magnification TEM image of the duodenum (left) is followed by a higher-magnification TEM image (middle) and its corresponding EDS analysis (right). White boxes indicate regions of EDS analysis. Arrows indicate electron-dense vesicular structures while arrowheads indicate non-vesicular structures. Scale bar = 500 nm.
Abbreviations: mv, microvilli; ec, enterocyte; ICAM, intercellular adhesion molecule; GI, gastrointestinal; TEM, transmission electron microscope; EDS, energy dispersive X-ray spectroscopy.
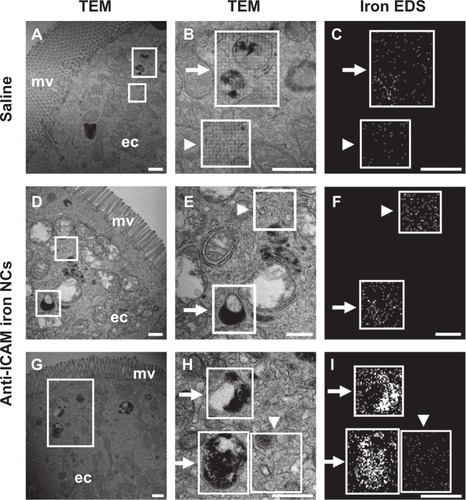
Figure S1 Visualization of antibody and antibody-coated nanocarriers in the GI tract. Mice were gavaged with saline, FITC-labeled IgG, or IgG-coated NCs and sacrificed 5 minutes or 30 minutes later. Their GI tracts were then excised and illuminated by UV light.
Notes: Stomach and small intestines (duodenum, jejunum, and ileum) are shown. Scale bar = 1 cm.
Abbreviations: GI, gastrointestinal; NC, nanocarrier.
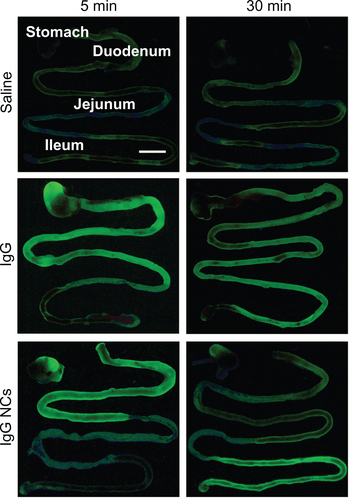
Figure S2 Effect of sedation on the GI biodistribution and degradation of 125I-IgG. Mice were injected intraperitoneally with PBS (nonsedated) or ketamine/xylazine (sedated), then orally gavaged with 125I-IgG in PBS. One hour later, sections of the GI were harvested and measured for their 125I-content, expressed as % ID (A). Samples were also subjected to TCA precipitation to determine the percentage of free 125Iodine, reflective of antibody degradation (B).
Notes: Data are mean ± SEM, (n ≥ 3). *P < 0.05; **P < 0.005 between sedated and nonsedated groups.
Abbreviations: GI, gastrointestinal; PBS, phosphate-buffered saline; % ID, percentage of the total injected dose; TCA, trichloroacetic acid; SEM, standard error of the mean.
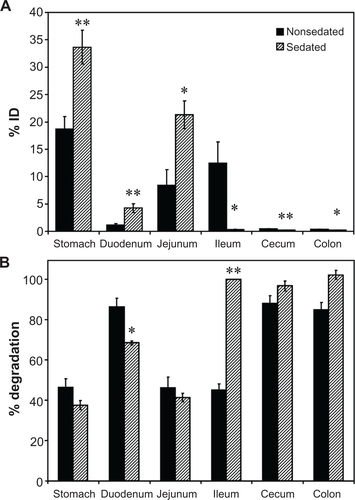
Figure S3 Effect of buffer composition on the GI biodistribution of IgG NC. Mice were gavaged with 125I-IgG NCs in either PBS or NaHCO3. One hour later, GI sections were harvested and measured for 125I-content, expressed as % ID (A). Samples were also subjected to TCA precipitation to determine the percentage of free 125Iodine, reflective of antibody degradation (B).
Notes: Data are mean ± SEM, (n ≥ 3). *P < 0.05; **P < 0.005 between saline and NaHCO3 groups.
Abbreviations: GI, gastrointestinal; NC, nanocarrier; PBS, phosphate-buffered saline; % ID, percentage of the total injected dose; TCA, trichloroacetic acid; SEM, standard error of the mean.
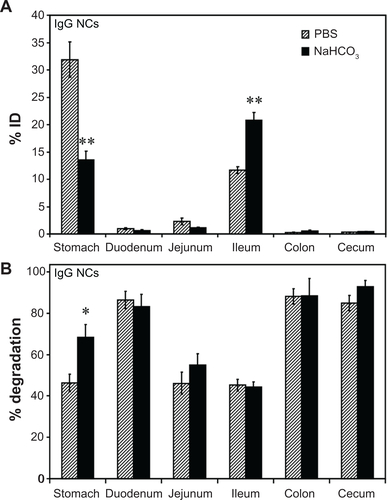
Figure S4 Biodistribution of anti-ICAM nanocarriers in the GI tract. Mice were gavaged with 125I-anti-ICAM NCs in PBS and euthanized after 30 minutes, 1 hour, or 3 hours, followed by determination of the 125I-content in the stomach, duodenum, and distal intestines (encompassing the jejunum, ileum, cecum, and colon), to determine the % ID (A). Mice were gavaged with 125I-anti-ICAM NCs in either PBS or NaHCO3 and euthanized after 30 minutes to determine their GI biodistribution (% ID) as described above (B).
Notes: Data are mean ± SEM, (n ≥ 3). (A) *P < 0.05; **P < 0.005 between 30 minutes and 1 hour or between 30 minutes and 3 hours. (B) **P < 0.005 between saline and NaHCO3 groups.
Abbreviations: ICAM, intercellular adhesion molecule; GI, gastrointestinal; NC, nanocarrier; PBS, phosphate-buffered saline; % ID, percentage of the total injected dose; SEM, standard error of the mean.
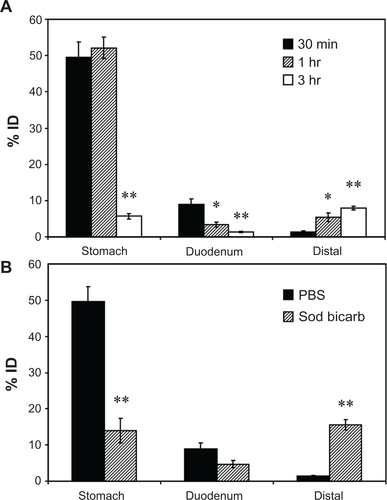
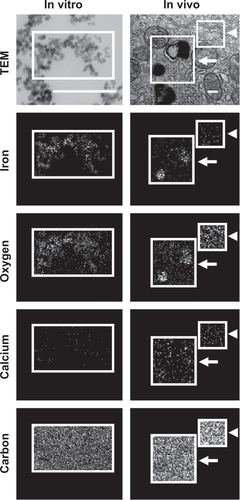
Figure S5 Visualization of anti-ICAM NCs by TEM and EDS. Antibody-coated iron oxide nanoparticles were directly coated onto microscope grids (in vitro, left column), or orally gavaged in mice followed by isolation 10 minutes later and processing of GI duodenal tissue sections (in vivo, right column).
Notes: Samples were imaged by TEM (upper row) and analyzed by EDS to detect iron, oxygen, calcium, and carbon signatures. White boxes indicate the region of analysis. White arrows indicate electron-dense vesicular compartments within GI epithelial cells, while white arrowheads represent non-vesicular compartments. Scale bar = 200 nm.
Abbreviations: ICAM, intercellular adhesion molecule; TEM, transmission electron microscope; EDS, energy dispersive X-ray spectroscopy; GI, gastrointestinal.