Figures & data
Figure 1 Intra-mammary gland fat pad injection of particular μCHER2 vaccine. (A) Schematic figure of vaccine preparation and intra-mammary gland fat pad injection. Porous silicon particles were visualized with scanning electronic microscope. Bar indicates 2 μm. Whole body imaging was taken 24 hours after vaccination by in vivo imaging system (IVIS-200) to confirm the success of vaccine injection. (B) Tracking of μCHER2 vaccine transport with IVIS-200 and (C) quantification of fluorescence intensity. Vaccine particles were prepared with Cy5.5-DOPE lipid, and dosed to mammary gland fat pad of Balb/c mice (n=3). At 24 hours post-treatment, mice were euthanized to collect fat pad, lymph nodes and major organs for quantitative analysis of accumulation of vaccine particles. Data were presented as mean ± SD.
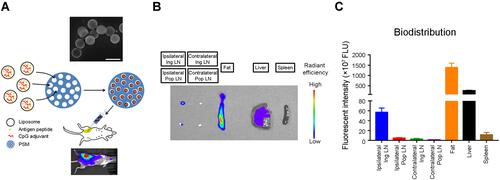
Figure 2 Infiltration of immune cells after fat pad vaccination. (A) Histological analysis of mammary gland fat pad at 1 day post-vaccine treatment. Fat pad samples were fixed and embedded in paraffin. Slices were stained with hematoxylin and eosin. μCHER2 particles in migrating cells re indicated with yellow arrows. (B) Flow cytometry analysis on infiltrating leukocytes in fat pad 24 hours after vaccination (n=7 mice per group). Different cell populations were analyzed at 24 hours by tSNE analysis (C). Total myeloid cells, monocytes and neutrophils were subsequently investigated at day 1 (D–G) or day 7 (H) samples in response to μCHER2 treatment. Data were presented as mean ± SD. *p<0.05, **p<0.01.
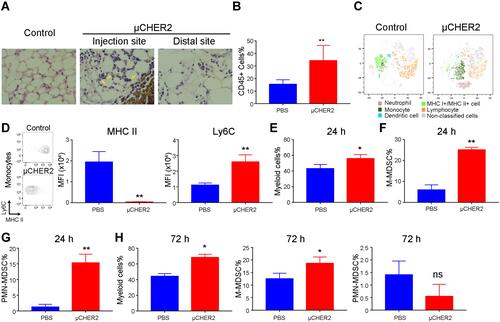
Figure 3 Analysis of activation and transport of dendritic cells after vaccination. At 24 hours post-vaccination, the population and activation of CD11c+MHC IIhi DC in (A) fat pad and (B) ipsilateral Ing LNs were analyzed with flow cytometry. Data were presented as mean ± SD. *p<0.05, **p<0.01, ***p<0.001.
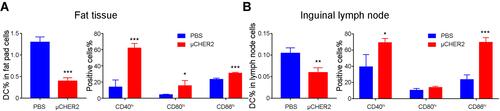
Figure 4 HER2-specific T cell response after μCHER2 vaccination. (A) Flow cytometry analysis on total T cells and CD8+ T cells in fat pad, spleen and inguinal lymph node at 7 days post-vaccination via mammary gland fat pad. (B) ELISpot assay of IFN-γ secreting antigen-specific T cells from fat pad, spleen and lymph nodes from mice treated with PBS or μCHER2. (C) Flow cytometry assay on HER2-specific T cell levels in spleen and fat pad at 7 days post-vaccination. For antigen-specific T cell analysis, data from independent studies were pooled for analysis. Data were presented as mean ± SD. *p<0.05.
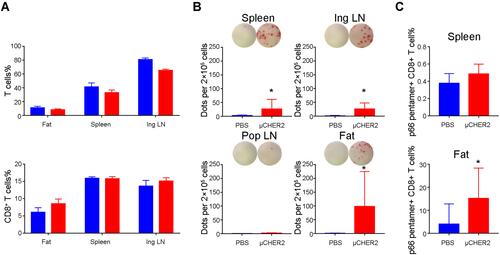
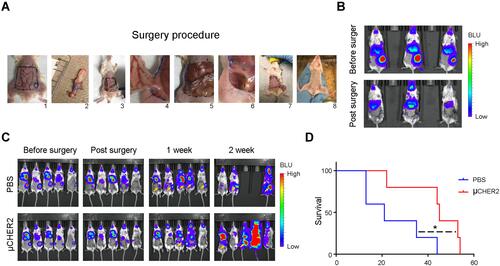
Figure 5 Anti-tumor activity from μCHER2 in mice bearing both orthotopic and systemic metastatic HER2-positive TUBO breast cancer. (A) Procedure of mastectomy and flap surgery on mice. Vaccines were given once via fat tissue flap during surgery. (B) Bioluminescence (BLU) monitoring of tumor resection surgery. (C) In vivo growth inhibition of TUBO tumor by μCHER2 treatment via mammary gland fat pad. Systemic TUBO tumor metastasis and local recurrence after mastectomy were monitored with IVIS-200 system (n=5 mice per group). Recurrence of primary tumor is indicated by yellow arrows. (D) Kaplan–Meier plot of animal survival. Difference in survival was compared by log rank test. Data were presented as mean ± SD. *p<0.05.