Figures & data
Figure 1 Schematic representation of the preparation process of phase-transition NPs.
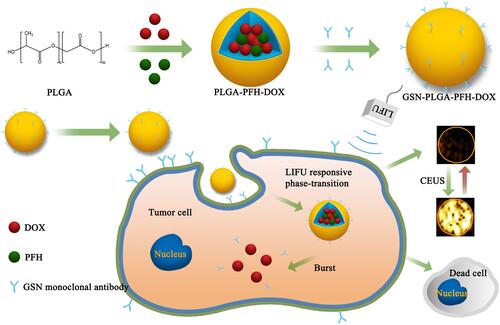
Figure 2 (A) SEM image of GSN-PLGA-PFH-DOX NPs (Scale bar: 500 nm). (B) TEM image of GSN-PLGA-PFH-DOX NPs (Scale bar: 200 nm). (C) sizes of the different PLGA NPs (*P<0.05 vs the other groups). (D) Size distribution of the different PLGA NPs. (E) Zeta potential of different PLGA NPs. (F) Different PFH dosages have no significant effect on DOX encapsulation efficiency and drug loading. (G and H) The size (G) and zeta potential (H) of GSN-PLGA-PFH-DOX NPs and GSN-PLGA-DOX NPs over a period of 7 days in a stability test.
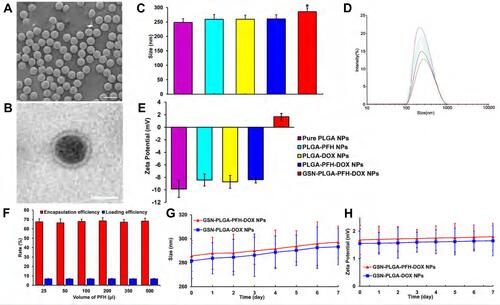
Figure 3 (A) The DiI-labelled NPs emitted red fluorescence. (B) FITC-labelled secondary antibody emitted green fluorescence after combination with NPs. (C) Both showed Orange fluorescence under the fusion channel. (D) Connection rate of the GSN monoclonal antibody on GSN-PLGA-PFH-DOX NPs. (E) Connection rate of the control group (Scale bar: 5 μm).
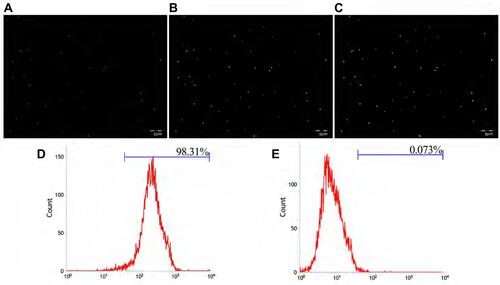
Figure 4 (A) Corresponding B-mode and CEUS images of the phase transition process of the GSN-PLGA-PFH-DOX NPs under LIFU irritation with different powers and times, as observed in vitro. Quantitative echo intensity of GSN-PLGA-PFH-DOX NPs and GSN-PLGA-DOX NPs in B-mode (B) and CEUS imaging (C) at different time points and powers under LIFU irradiation (**P<0.001 vs the other groups). (D) OM images of the LIFU-responsive phase transition process with a power of 8 W/5 min at different time points. (E) Drug-release profiles triggered by LIFU irritation (black arrow: ultrasound administration).
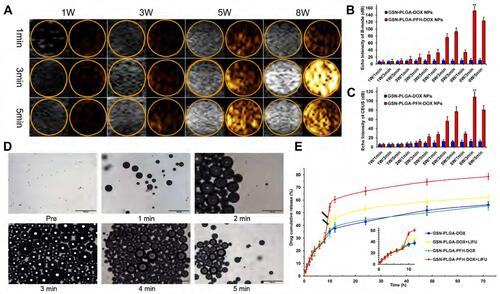
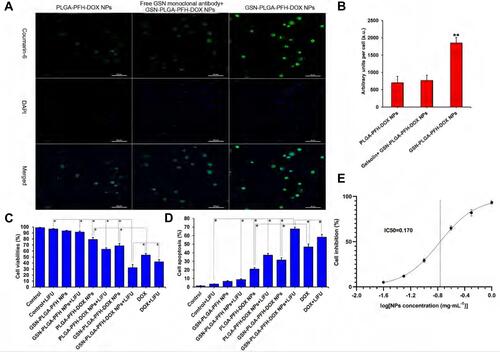
Figure 5 (A) Cell uptake observed by LSCM (Coumarin-6: green, DAPI: blue) (Scale bar=50 μm). (B) Histogram of the quantitative study of the cellular uptake efficiencies of different groups (**P<0.001 vs the other two groups). (C) Cell viability rates of various therapeutic agents, *P<0.05. (D) Cell apoptosis rate of various therapeutic agents, *P<0.05. (E) Fitting curve of half inhibition concentration of NPs.