Figures & data
Figure 1 The optical setup.
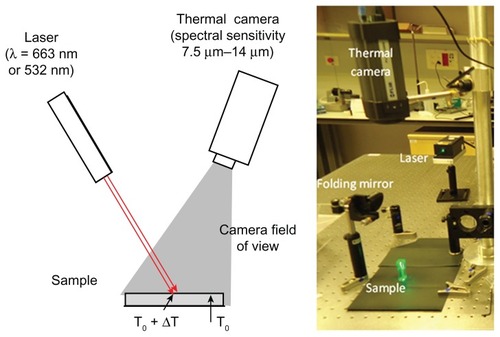
Figure 2 Left: Absorbance spectra of gold nanospheres (green) and gold nanorods (dashed red).
Notes: The wavelengths of the lasers are shown by the arrows. Right: transmission electron microscopy image of 30 nm gold nanospheres (upper figure, scale bar 100 nm) and 25 nm × 65 nm gold nanorods (lower figure, scale bar 100 nm).
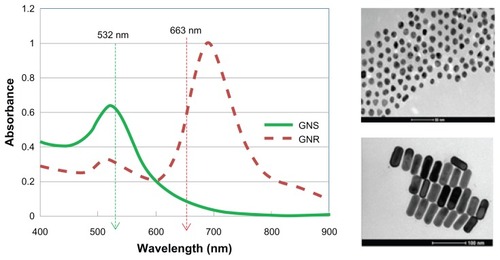
Figure 3 Temperature elevation as a function of irradiation time with the 663 nm laser for different concentrations of gold nanorods in aqueous solution.
Note: The graph reaches a plateau after approximately 5 seconds.
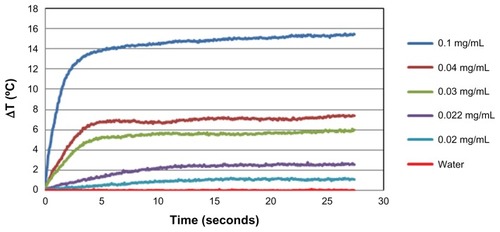
Figure 4 Temperature elevation as a function of concentrations of gold nanospheres (A) and gold nanorods (B) for the two lasers.
Notes: The time point for comparison was after 5 seconds of laser irradiation, when the temperature curves had reached a plateau. The laser optical intensity on the sample was 10 W/cm2 for both lasers.
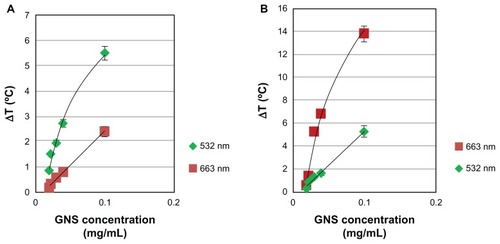
Figure 5 Thermal images of a sample made of two half-cylindrical solid phantoms joined together, one with gold nanorods and the other without. Image (A) was taken before laser irradiation. The border between the phantoms is shown by a dashed straight line. The elliptical contour shows the place where the laser beam hits the sample. Images (B) and (C) were taken after 10 seconds and 5 minutes of laser irradiation, respectively.
Note: It can be seen that the temperature in the part of the sample with the gold nanorods rises compared with that in the part without gold nanorods.
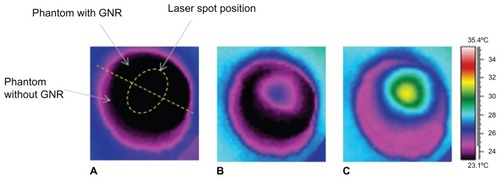
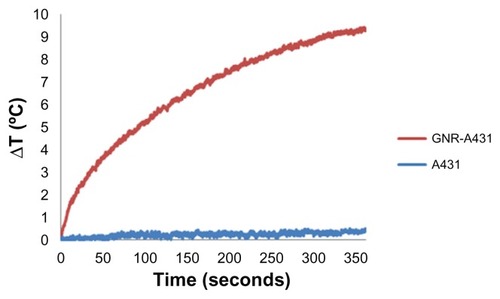
Figure 6 Temperature elevation of gold nanorods bioconjugated with an A431 cancer cell line compared with A431 cells without gold nanorods in solution.
Notes: It can be seen that the bioconjugated GNR-A431 has a distinctive heating profile compared with the A431 cells.