
Figures & data
Figure 1 Schematic illustration for (A) the chemical structure of (-)-gossypol; (B) the chemical structures of mPEG-DSPE and cRGD-PEG-DSPE; (C) the design and preparation of cRGD-decorated liposome (cRGD-LP) with enhanced tumor-targeting for drug delivery.
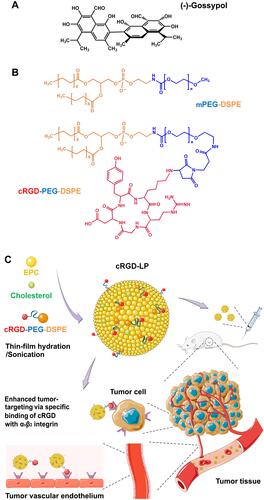
Table 1 Summary of the Characteristics of Gos/LP and Gos/cRGD-LP. Data are Shown as Mean ± SD (n = 3)
Figure 2 (A) Particle size distribution, (B) zeta potential, and (C) TEM images of DiR/LP and DiR/cRGD-LP.
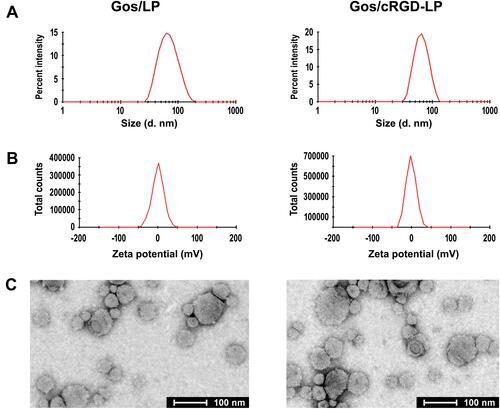
Figure 3 In vitro release profiles of (-)-gossypol from DiR/LP and DiR/cRGD-LP in PBS at 37 °C. Data are shown as mean ± SD (n = 3). The two formulations showed similar drug release profiles.
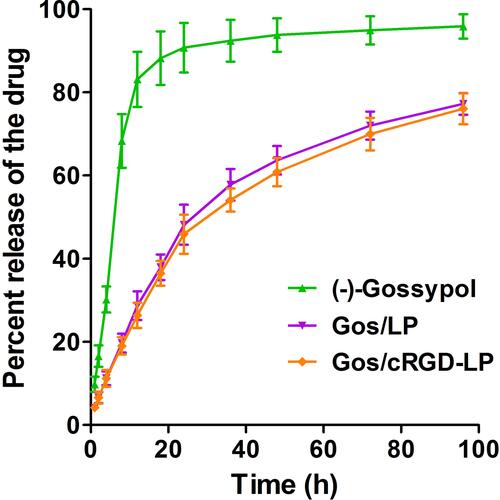
Figure 4 The viability of (A) PC-3 (prostate cancer) and (B) HCT-116 (colon cancer) cells treated with free (-)-gossypol, Gos/LP, Gos/cRGD-LP, and blank cRGD-LP. Data are shown as mean ± SD (n=3). For PC-3 cells, free (-)-gossypol showed lower IC50 as compared with Gos/LP (**p < 0.01) and Gos/cRGD-LP (*p < 0.05); Gos/cRGD-LP showed lower IC50 as compared with Gos/LP (#p < 0.05). For HCT-116 cells, free (-)-gossypol showed lower IC50 as compared with Gos/LP and Gos/cRGD-LP (**p < 0.01); the difference between Gos/LP and Gos/cRGD-LP was not statistically significant (p > 0.05).
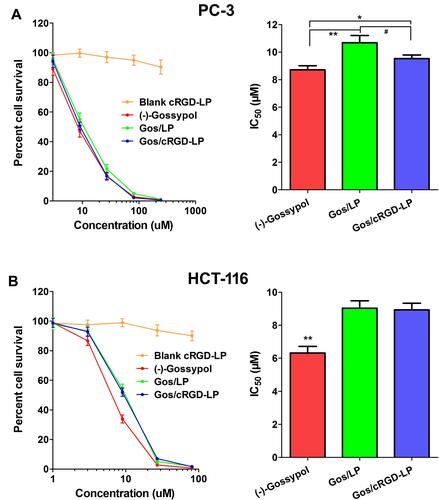
Table 2 Maximum Tolerated Dose (MTD) of Gos/LP and Gos/cRGD-LP. Data Were Obtained from the Observation for 10 Days After the Injection
Figure 5 In vivo NIR fluorescence imaging of PC-3 tumor-bearing nude mice injected with DiR-loaded liposomes (cRGD-LP or LP) or free DiR dissolved in ethanol/PBS (1:4, v/v). Each mouse was given the same amount of DiR whatever the formulation. The fluorescence images were obtained at different time points after the injection under the same imaging settings. The tumor regions of each mouse at 1 h are indicated by yellow dash circles.
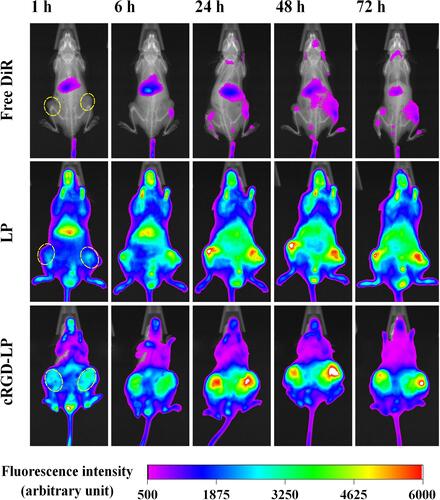
Figure 6 Quantitative analysis of in vivo NIR fluorescence imaging. (A) The DiR fluorescence intensity curves of the tumor regions in the mice receiving DiR-loaded liposomes (cRGD-LP or LP) or free DiR. (B) The tumor-targeting index (TTI) curves of different groups. (C) The relative area under the TTI-time curve (AUTC) of each group. Data are shown as mean ± SD (n = 6). In figures (A) and (B), **p < 0.01 and ***p < 0.001 for LP as compared with free DiR at the same time points; #p < 0.05 for cRGD-LP as compared with LP at the same time points. In figure (C), ***p < 0.001 for LP as compared with free DiR; #p < 0.05 for cRGD-LP as compared with LP.
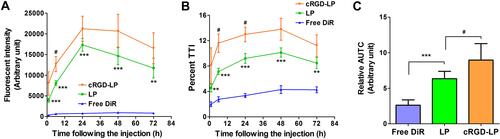
Figure 7 Ex vivo NIR fluorescence imaging of tumors and organs/tissues from the mice injected with DiR-loaded liposomes (cRGD-LP or LP) or free DiR. The tumors and organs were harvested at 72 h after the injection. The fluorescence images were obtained under the same imaging settings.
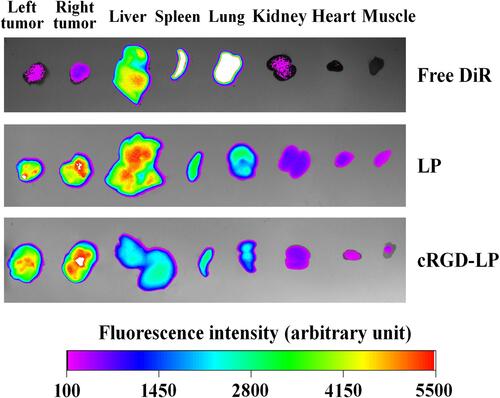
Figure 8 Quantitative analysis of ex vivo NIR fluorescence imaging. (A) The DiR fluorescence intensity of tumors and organs/tissues of the mice receiving DiR-loaded liposomes (cRGD-LP or LP) or free DiR. (B–D) Fluorescence intensity ratios of tumor to (B) liver, (C) spleen, and (D) lung. In figure (A), data are shown as mean ± SD (n = 6 for tumor, and n = 3 for organs/tissues). In figures (B–D), data are shown as mean ± SD (n = 6). **p < 0.01 and ***p < 0.001 for LP as compared with free DiR; #p < 0.05 for cRGD-LP as compared with LP.
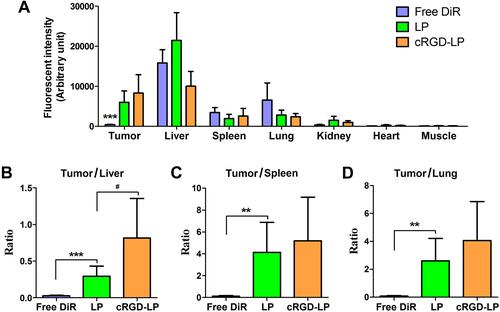
Figure 9 (A) In vivo tumor growth curves. PC-3 tumor-bearing nude mice were given PBS (i.v., blank control), blank cRGD-LP (i.v., vehicle control), free (-)-gossypol (P.O., 15 mg/kg), Gos/LP (i.v., 15 mg (-)-gossypol/kg), or Gos/cRGD-LP (i.v., 15 mg (-)-gossypol/kg). The arrows indicate the treatment time points. Data are shown as mean ± SEM (n = 8). On day 25, **P < 0.01 (Gos/cRGD-LP vs Gos/LP) and ***P < 0.001 [Gos/LP vs (-)-gossypol; and (-)-gossypol vs PBS]. (B) Changes in the tumor growth inhibition rate (IR) of each group as compared with the PBS group. The IR was over 50% for Gos/cRGD-LP group after day 16, and for Gos/LP group after day 19. (C) Pathological section images of the tumor tissues from different groups. The blue stains indicated the normal tumor cells. The brown stains indicated the apoptotic body or apoptotic nucleus. (D) Changes in the body weight of each group. Data are shown as mean ± SEM (n = 8). No significant change has been observed in the body weight of each group during the experiment. (E) The plasma potassium (K+) levels of mice after different treatments. Data are shown as mean ± SD (n = 8). Nude mice were given free (-)-gossypol (P.O., 15 mg/kg), Gos/LP (i.v., 15 mg (-)-gossypol/kg), or Gos/cRGD-LP (i.v., 15 mg (-)-gossypol/kg), once every three days, for 6 times in total. The plasma K+ levels of the mice were tested on the day after the last treatment.
![Figure 9 (A) In vivo tumor growth curves. PC-3 tumor-bearing nude mice were given PBS (i.v., blank control), blank cRGD-LP (i.v., vehicle control), free (-)-gossypol (P.O., 15 mg/kg), Gos/LP (i.v., 15 mg (-)-gossypol/kg), or Gos/cRGD-LP (i.v., 15 mg (-)-gossypol/kg). The arrows indicate the treatment time points. Data are shown as mean ± SEM (n = 8). On day 25, **P < 0.01 (Gos/cRGD-LP vs Gos/LP) and ***P < 0.001 [Gos/LP vs (-)-gossypol; and (-)-gossypol vs PBS]. (B) Changes in the tumor growth inhibition rate (IR) of each group as compared with the PBS group. The IR was over 50% for Gos/cRGD-LP group after day 16, and for Gos/LP group after day 19. (C) Pathological section images of the tumor tissues from different groups. The blue stains indicated the normal tumor cells. The brown stains indicated the apoptotic body or apoptotic nucleus. (D) Changes in the body weight of each group. Data are shown as mean ± SEM (n = 8). No significant change has been observed in the body weight of each group during the experiment. (E) The plasma potassium (K+) levels of mice after different treatments. Data are shown as mean ± SD (n = 8). Nude mice were given free (-)-gossypol (P.O., 15 mg/kg), Gos/LP (i.v., 15 mg (-)-gossypol/kg), or Gos/cRGD-LP (i.v., 15 mg (-)-gossypol/kg), once every three days, for 6 times in total. The plasma K+ levels of the mice were tested on the day after the last treatment.](/cms/asset/81608520-bf0c-4c1c-88ba-534ac825aa12/dijn_a_341824_f0009_c.jpg)